Create Template
To create a new report template:
-
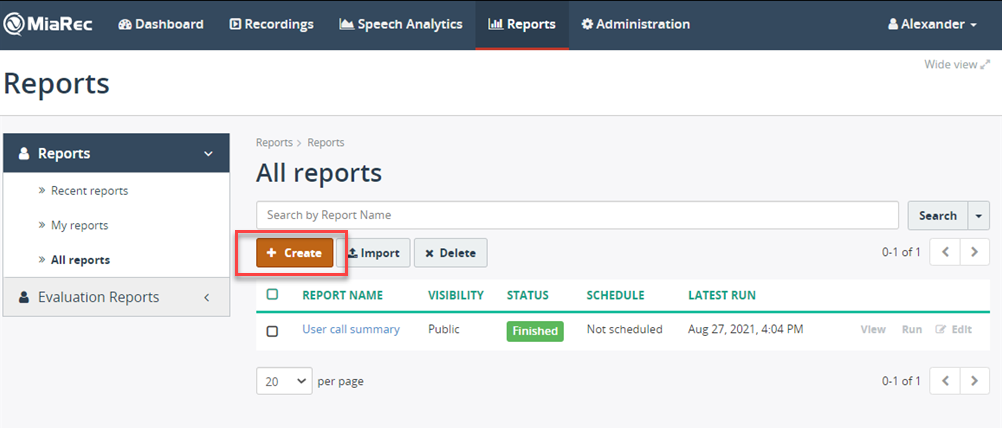
Navigate to Reports, then All reports > Create.
-
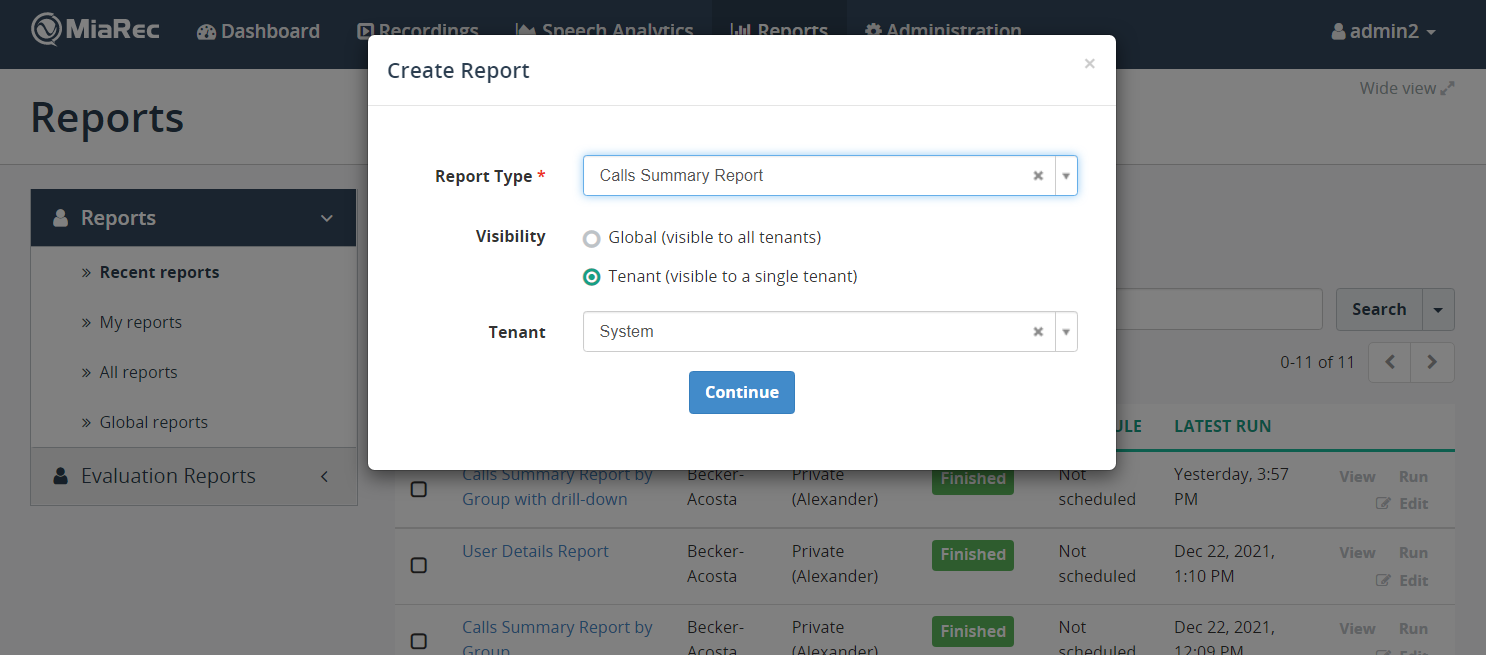
In the Create Report dialog box, fill in the following fields and click Continue:
- Report Type - Choose a specific report type to create . To learn more about a specif report type, see Report types.
- Visibility - Decide whether the report template will be visible to all tenants or a specific single tenant. Note, this option is applicable for a multi-tenant environment only.
- Tenant - Choose a specific tenant from the list of registered tenants. This field is available only when the Visibility field is set to
Tenant.
-
Fill in the following fields:
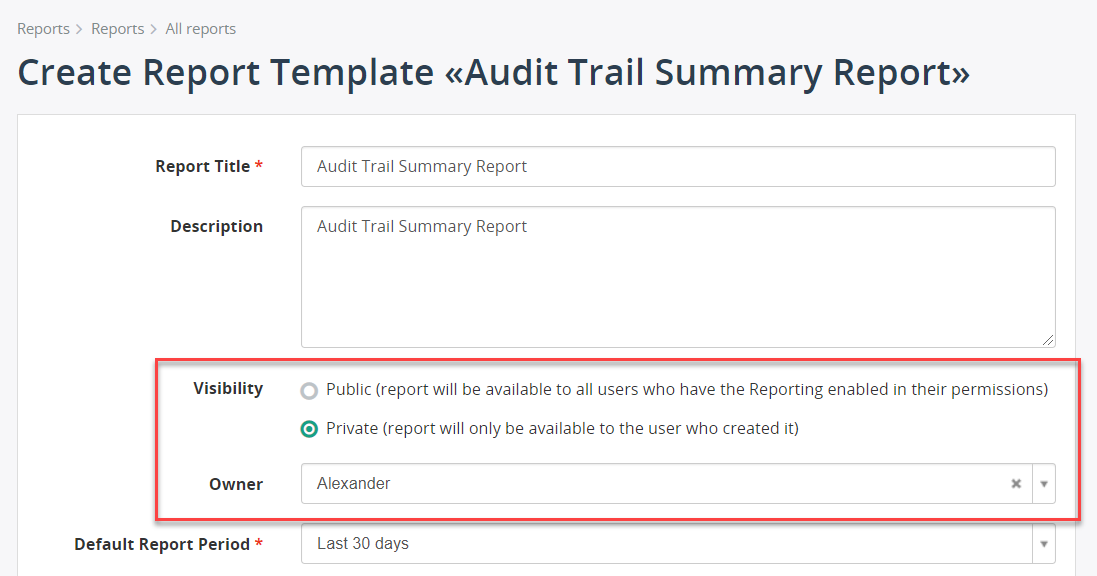
- Report title - Give your report a distinctive name. Required field.
- Description - Provide the summary information for a given report.
- Visibility - Decide whether the report template will be visible to all users or you only. For details, see Visibility settings.
- Owner - Choose the owner of the report from the list of available users/tenants. This owner will be specified when applying scheduling and distribution options. This field is available only when the Visibility field is set to
Private. - Default Report Period- Set the time period for the report to limit report data to specific timeframe. Required field.
- Timezone - If you wish to run the report in a different timezone, select the appropriate value from the list. Note, timezone affects the scheduler, date/time attribute in Filtering Criteria and DateTime format, if applicable.
- Keep reports history- Specify how many days the built reports will be kept in the report server database.
- Caching - Enable report caching. Caching can shorten the time required to build a report if the report is run frequently. We recommend leaving this setting enabled.
- Users can modify filters - This setting allows you to change filtering criteria when you run the report.
- Report Page Size - Change the page size for the report.
- Page Orientation - Change the page orientation for the report.
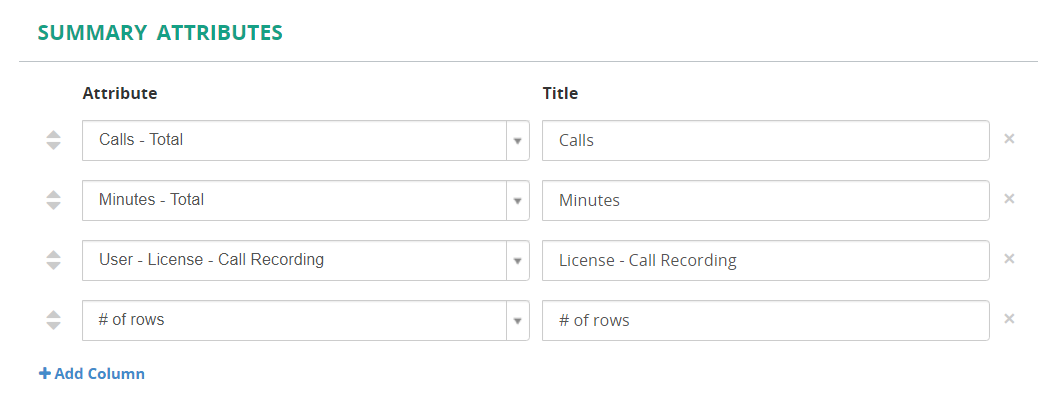
Summary Attributes
Determine the columns that will appear in the summary table. The summary table is a visualization that summarizes statistical information about data in table form. For each column header, you can define a custom title.
Info
You can re-order columns via drag-and-drop.
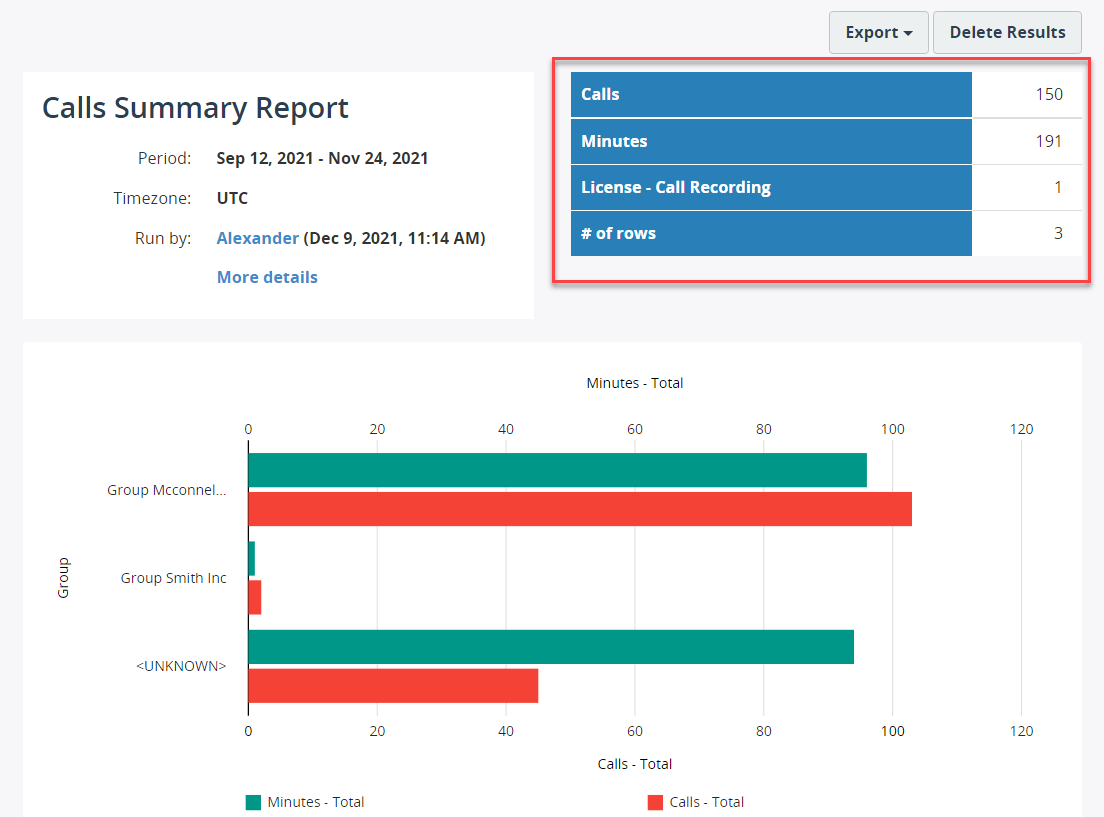
With the above attributes configuration, the summary table will look as follows:
Visibility Settings
When creating a new report template, in the Visibility field, you can set up whether this report template will be accessible to all users (provided they have appropirate permissions set up) or to the report owner (set in the Owner field).
Info
The visibility affects the report template only, i.e. even if the report template is public, the individual run of a report will be visible only to the user who built the report and the administrator only. Users are not able to see the report runs of other users.
Info
You can apply scheduling options only to the templates that are set as Private and are assigned to a specific user. (check that the Private option is selected in the Visibility field, and the Owner field is filled out).
Info
The results from the public reports can vary depending on the user who runs the report. For example, if the report is executed by the administrator, who can access all user groups, the report will contain the users from all groups. If another user, who can access only one user group, runs the same public report, the report data will be limited only to users from that one group.
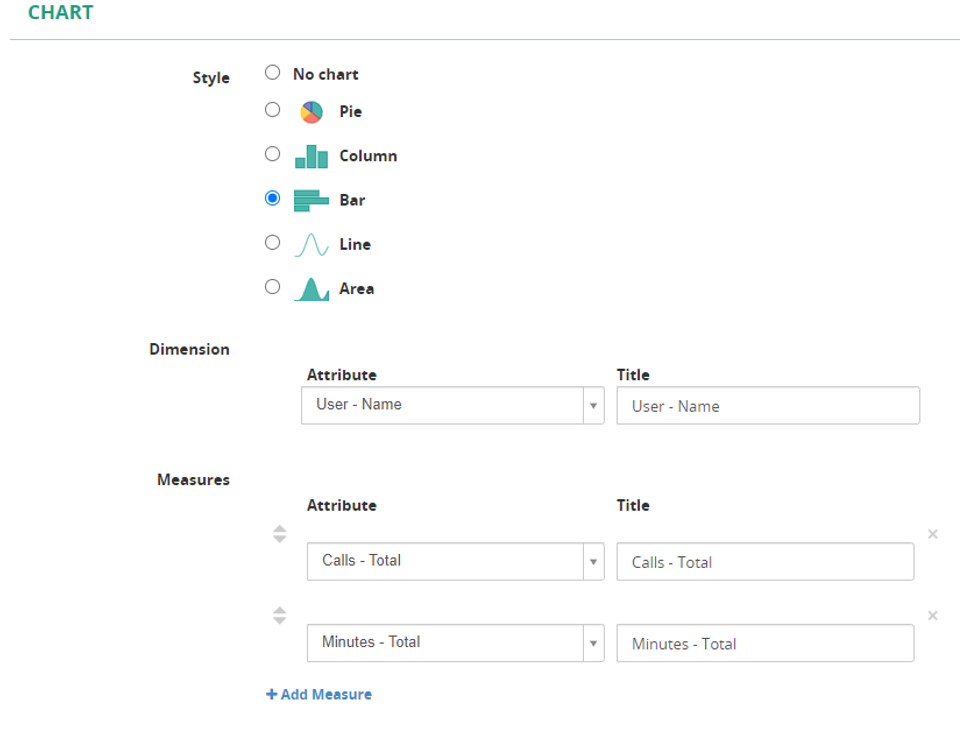
Chart
You can display the charts in the report using a variety of presentation platforms, such pies, columns, bars, etc., Also, you can display custom data labels instead system attributes when configuring a specific chart.
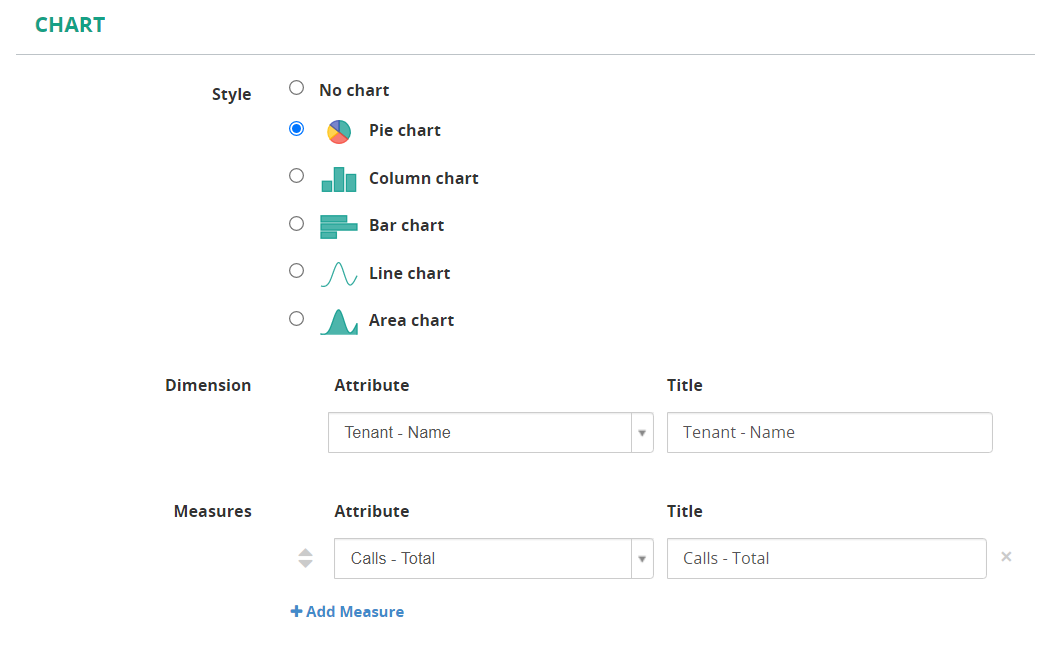
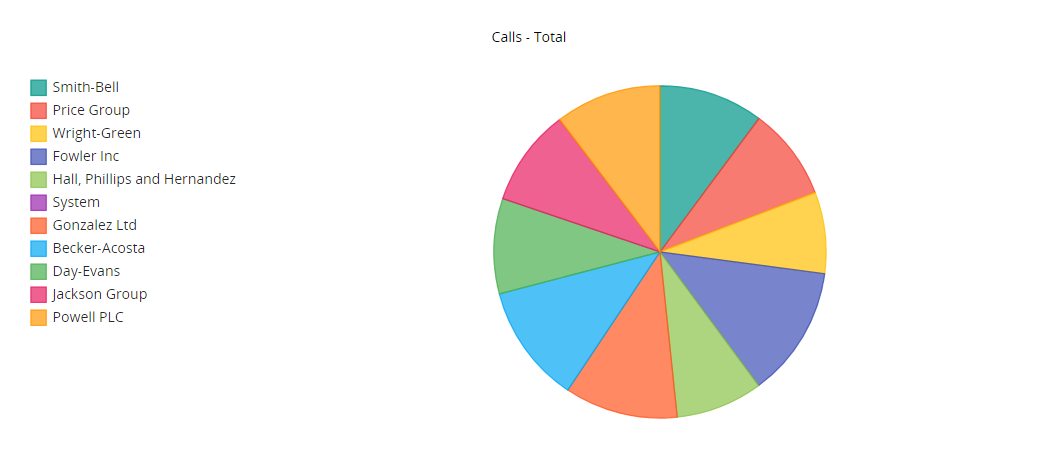
Pie chart
This chart type displays as a pie chart and compares proportions of data and how they contribute to a whole. A pie chart can have one dimension and one measure. The measure is used to determine the angle of each slice in the chart.
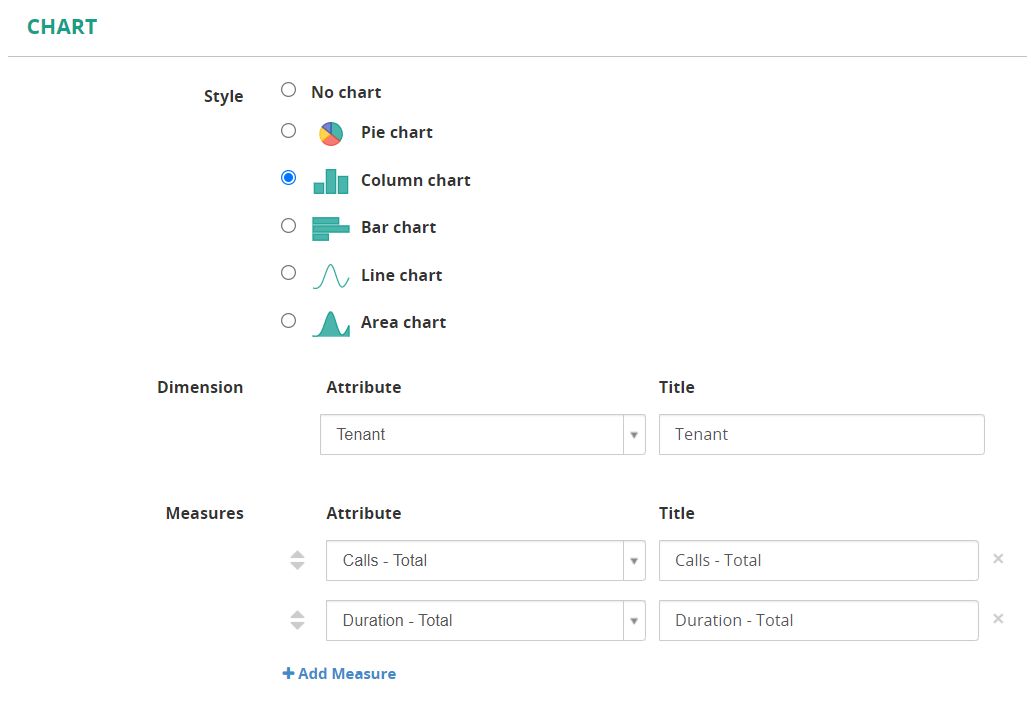
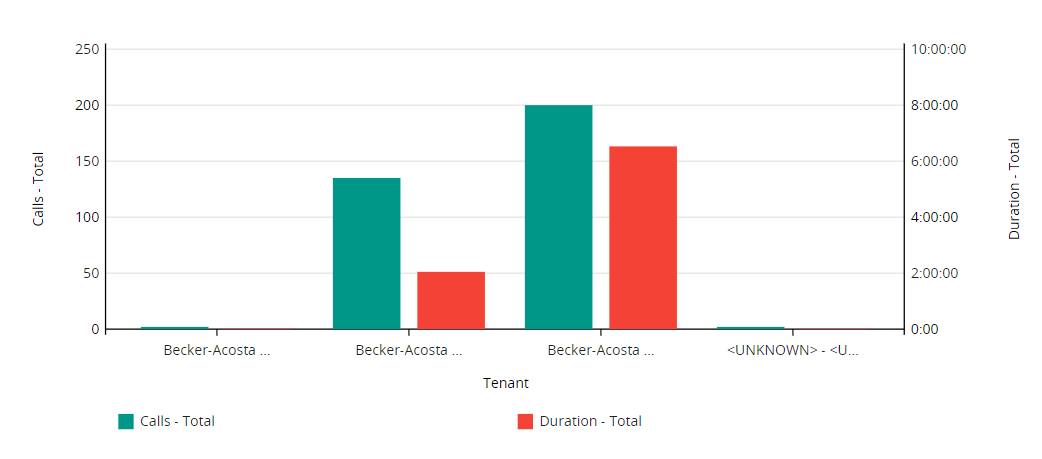
Column chart
This chart type displays as vertical lines and compares values across a range. The Dimension field is used to define the dimensions for the chart, which displays as the X axis. The Measure field **** is any string or numeric field that can be measured. The measure is the Y axis of the chart. You can have multiple measures defined.
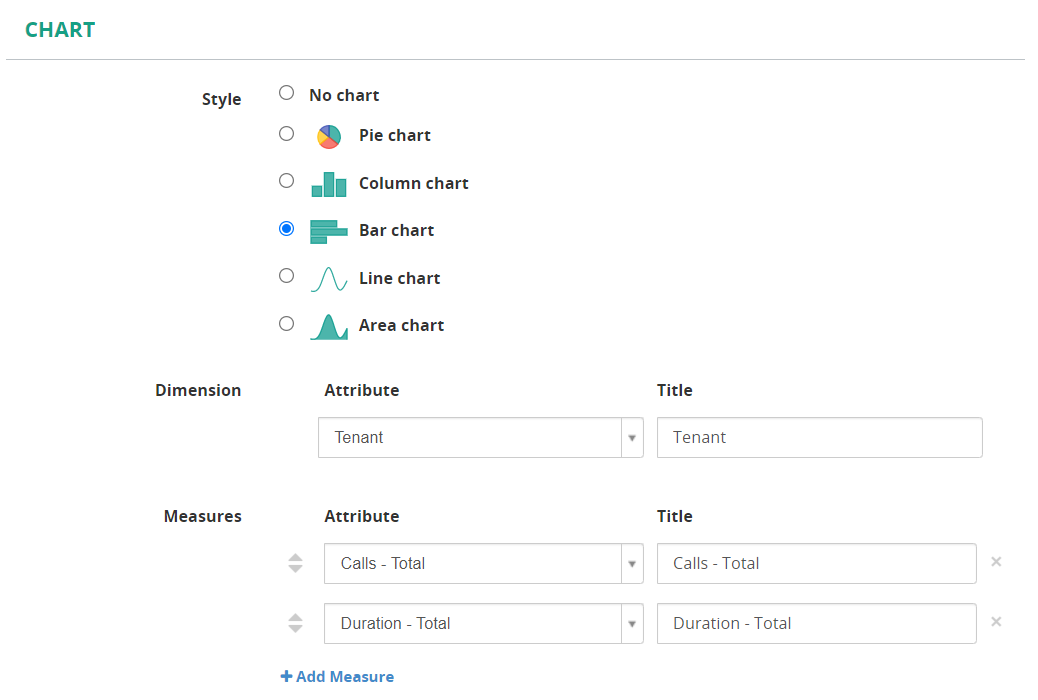
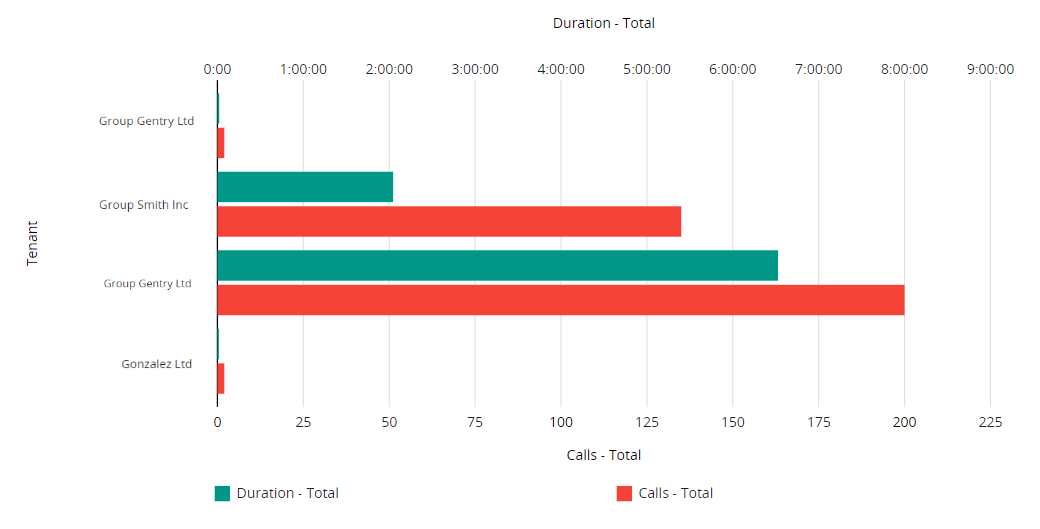
Bar chart
This chart type displays as horizontal bars and compares multiple values with each other. The Dimension field displays as the Y axis. The Measure field **** is the X axis of the chart. You can have multiple measures defined.
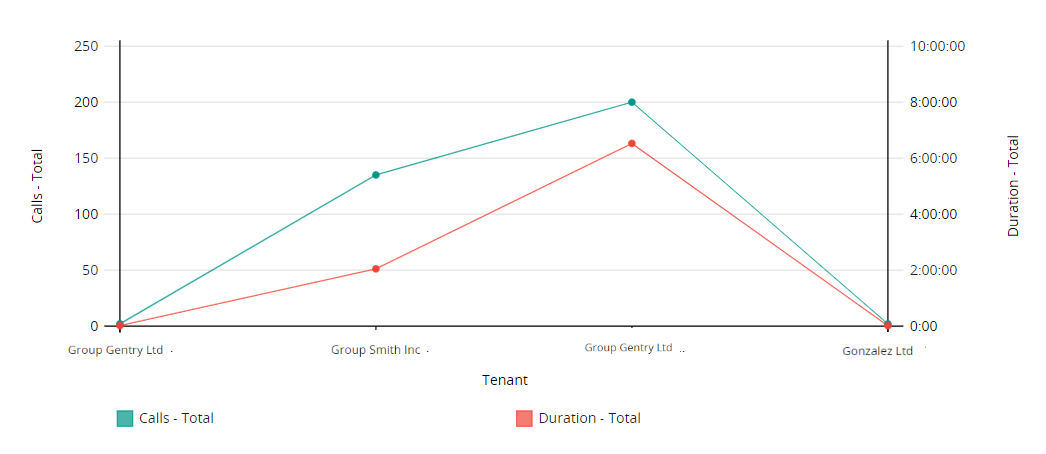
Line chart
This chart type displays as a line graph and shows trending over time. The Dimension field displays as the X axis. The Measure field **** is the Y axis of the chart. You can have multiple measures defined.

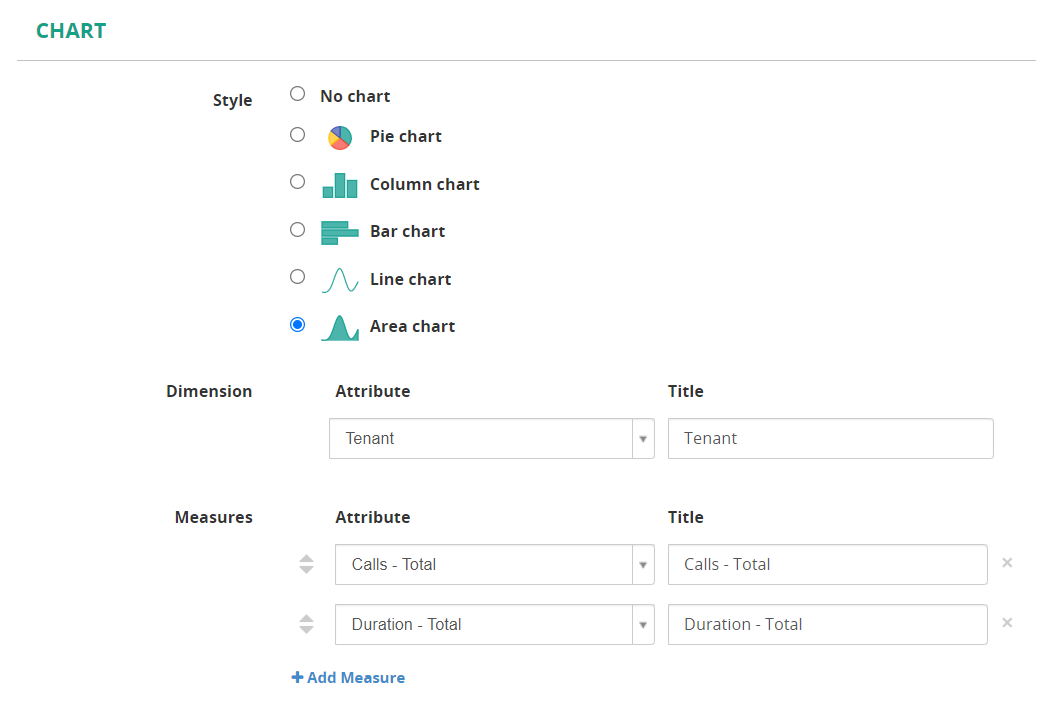
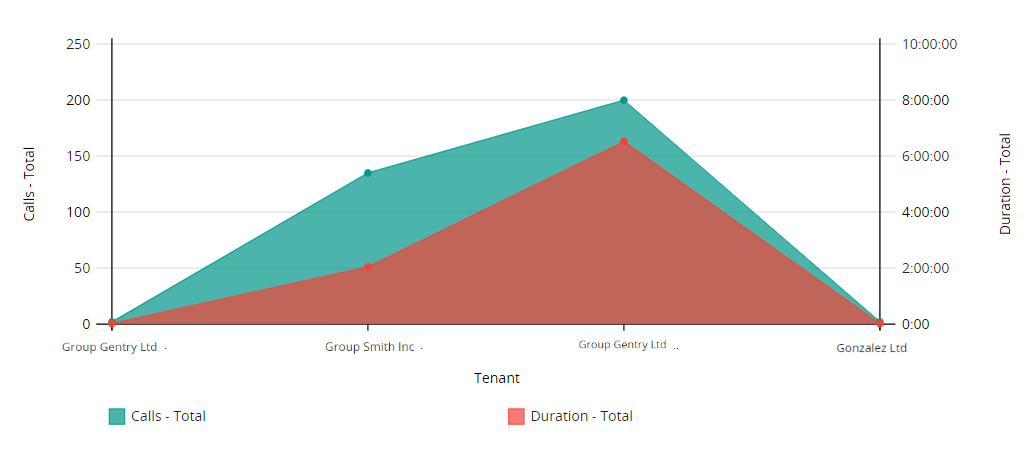
Area chart
An area chart is based on a line chart, however it is distinguished from the last one by the addition of shading between lines and a baseline, like in a bar chart. The Dimension field displays as the X axis. The Measure field **** is the Y axis of the chart. You can have multiple measures defined.
Sorting
You can sort report results in ascending or descending order on one or more of the columns in the result set.
To specify or change the order in which results are sorted:
- Under the Sorting section, in the Attribute field, select the column that you want to reorder.
- In the Sorting field, choose
ASCorDESCto specify the sort order for this column.
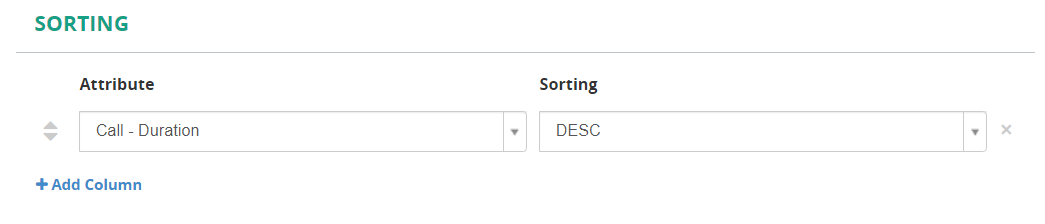
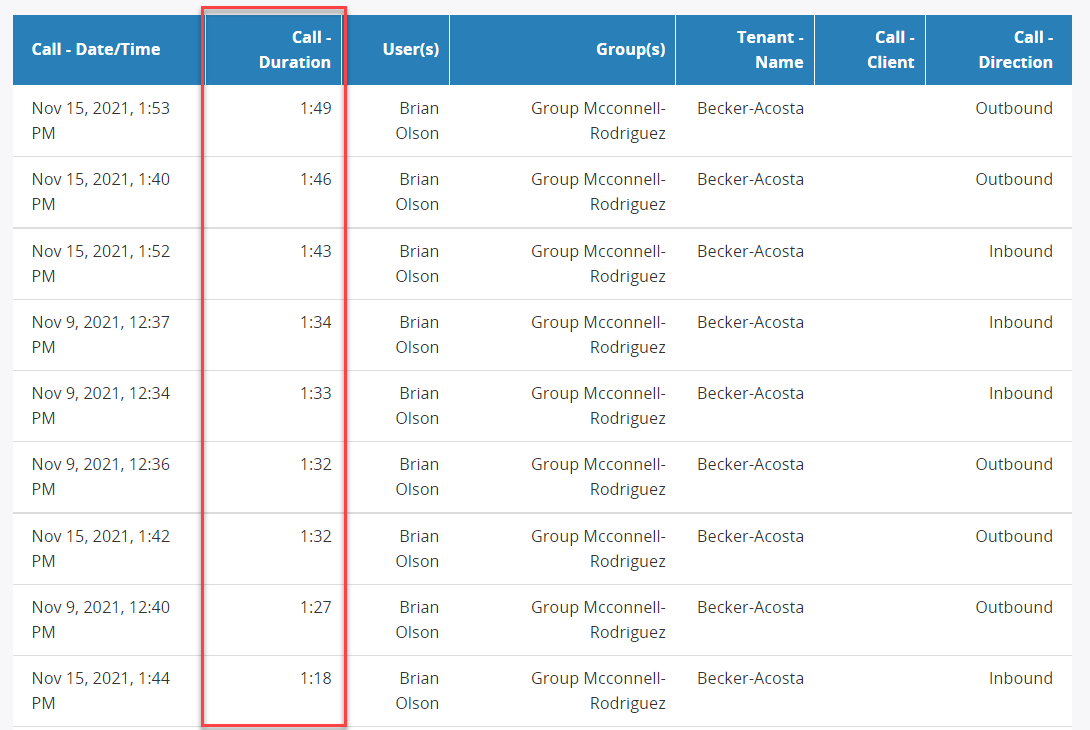
With the above sorting configuraiton, your report data will now be sorted by Call-Duration in descending order.
Info
To add more columns for sorting, click +Add Column. The column that is listed first takes precedence, that is, the result set is sorted by the first column and then that sorted result set is sorted by the second column, and so on.
Columns
MiaRec allows you to define the columns that your report should display.
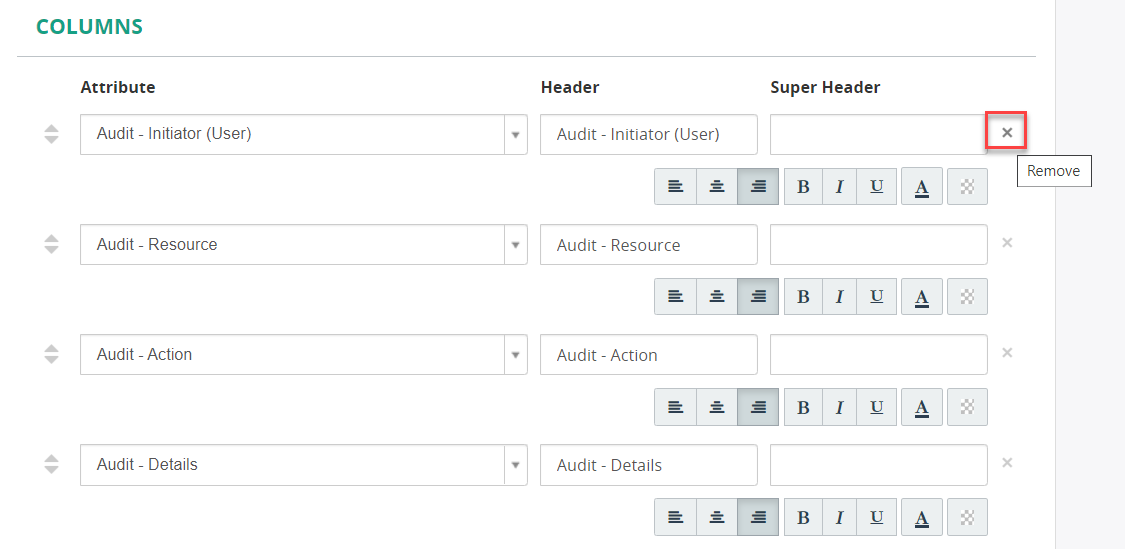
To hide a column, click on the Remove icon that appears next to it.
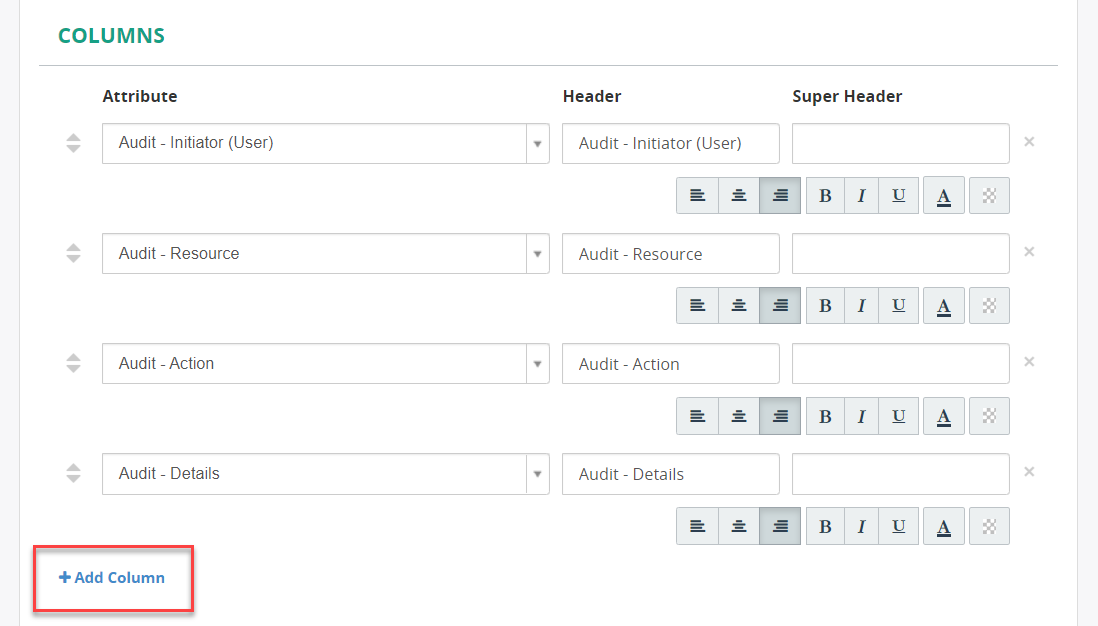
To add a new column, click +Add Column.
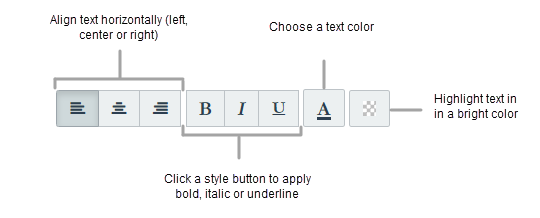
You can change the font style (for example, bold, italic, underline) of any column header. You can also change the text color, and align the text horizontally.
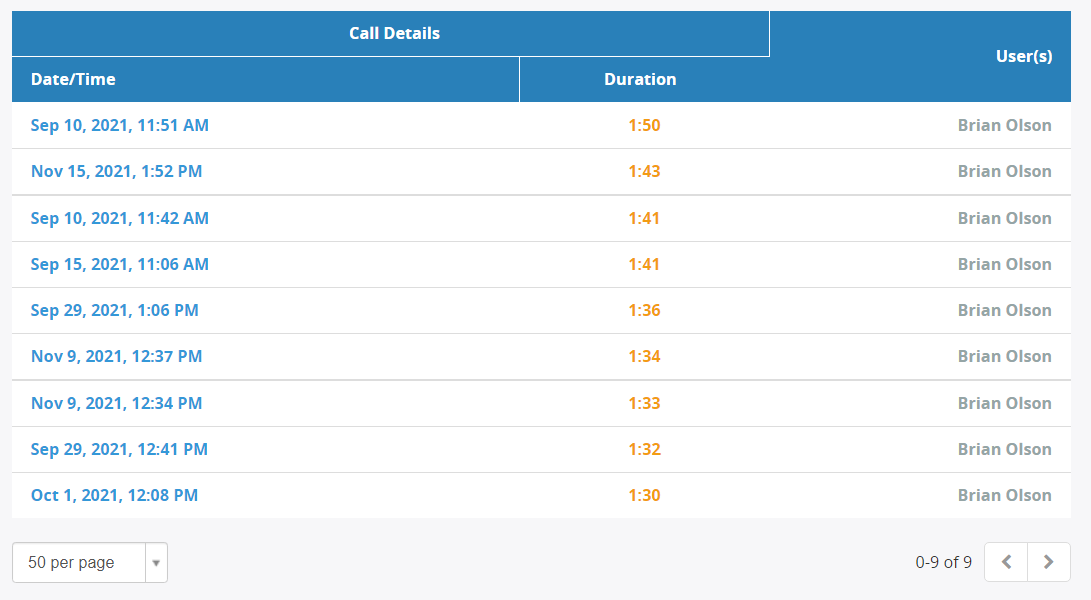
Also, you can set up a Super Header, which spans multiple columns and is displayed on top of these columns. To configure this shared header, enter the same title for all target columns, under the Super Header field.
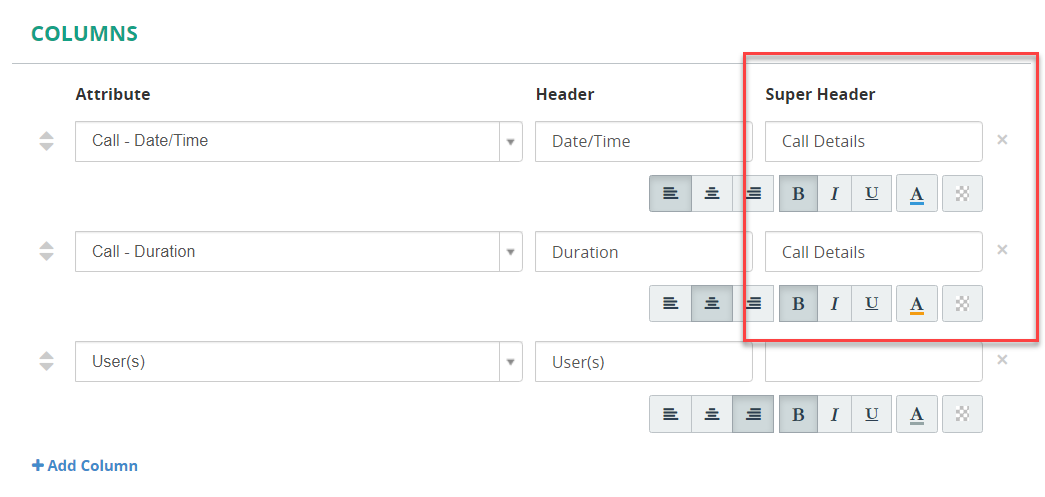
With the above column configuration, your report columns will look as follows:
Filtering Criteria
Specify filtering criteria for the reports. For example, you can limit data to specific group, duration, date, etc. The example below illustrates a scenario when a report includes only the inbound calls with a duration more than 1 minute and 30 seconds.
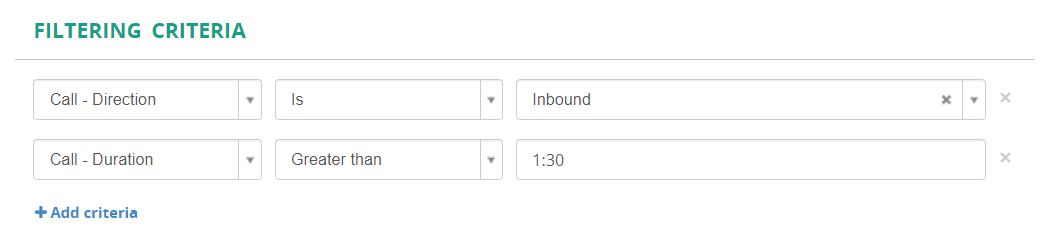
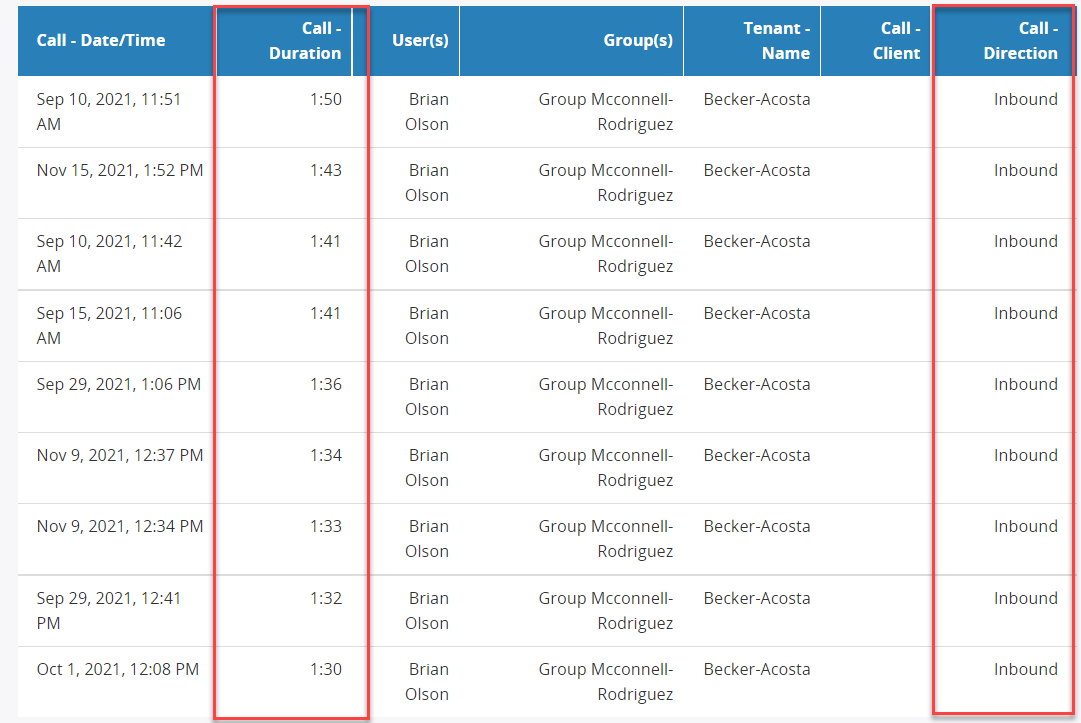
With the above filtering configuraiton, your report data will now include only inbound calls that lasted more than a minute and a half.
Send Report by Email
You can send the report as PDF or Excel file (or both) by e-mail when the build process completes. You can do this one time or you can specify to have the report sent on a recurring basis automatically by addressing to the Schedule options. When you do this, the report will run before it's sent so that it will always contain the most up-to-date information.
To enable the email distrubution:
- Select the Send report by email check box.
- In the Attachment formats field, select the attachment type, either PDF or Excel
- In the Send to email field, enter the email address of the recipient.
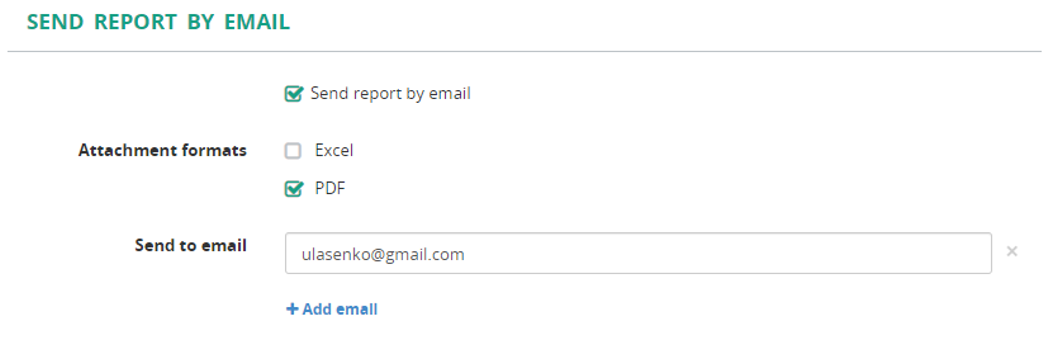
Info
Clicking Add email will allow you to specify multiple recipients for the report. Separate multiple email addresses with a comma.
Schedule
You can schedule any report that you can access to be automatically generated and emailed at regular intervals.
The following interval options are available:
- Manually - no scheduling options are applied.
- Every Hour - the scheduler will run the report every hour. Additionaly, you may specify the Time option that accounts for a certian minute when the scheduler should trigger the job. Permittable values:
0-59 - Every Day - the scheduler will run the report every day. Additionaly, you may specify Time when the scheduler should trigger the job. Supported format:
HH-MM. - Every Week - the scheduler will run the report every week. Additionaly, you may specify Time when the scheduler should trigger the job. Supported format:
HH-MM. - Every Month - the scheduler will run the report every month. Additionaly, you may specify Time (HH:MM) and Weekdays when the scheduler should trigger the job.
- Custom crontab - this option allows you to set up a custom interval. For instance, the following screenshot illustrates the configuration on how to run the report at 5pm on Mon-Fri (i.e. ignoring weekends).
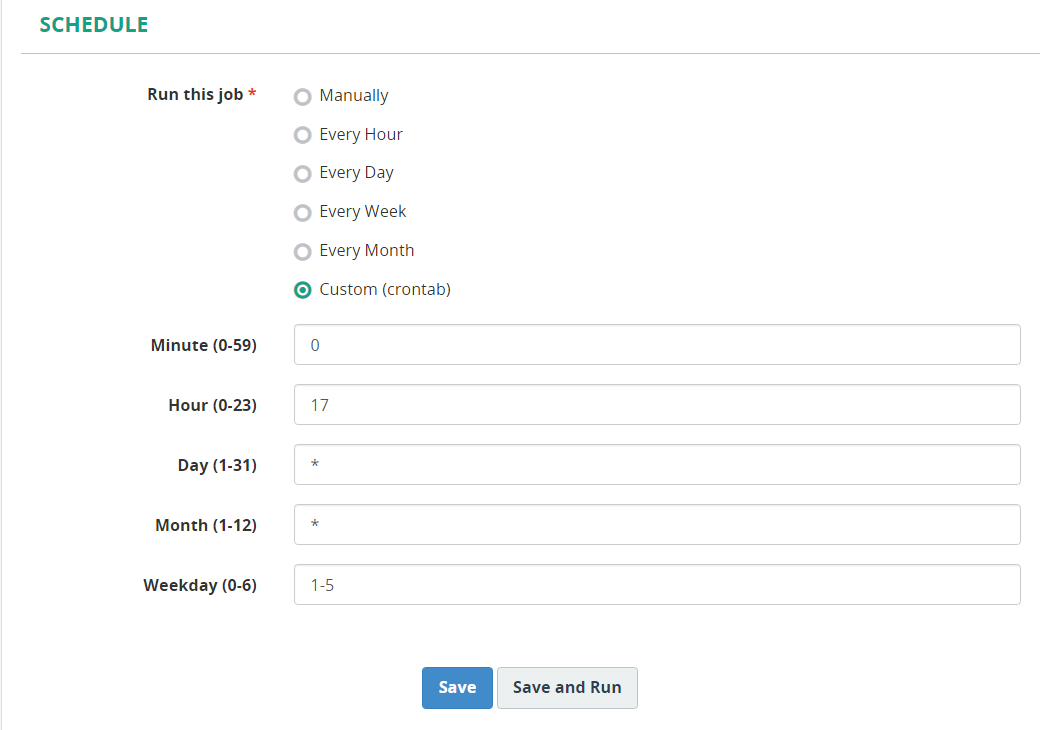
The asterisk ('*') operator (frequently known as a wildcard) specifies all possible values for a field. For example, an asterisk in the hour field would be equivalent to 'every hour'. **** If you set the cron job to run on a specific day of the week, the month and day of month fields will still appear as an asterisk (*). The day of the week value will override these values, so it will only run once per week on your selected day.
Info
You can apply scheduling options only to the templates that are set as "Private" and are assigned to a specific user. (check that the Private option is selected in the Visibility field, and the Owner field is filled out).