QA Dashboard
Once the call recordings have been evaluated, you can check evaluation results by navigating to the QA dashboard.
The QA dashboard is an intuitive visual reporting tool that provides useful statistics, such as an average, minimum and maximum agent's score for the given period, total evaluations for a specific group or agent, etc., This allows customer service managers and teams to monitor and optimize performance and spot emerging trends in a central location.
Key features of the QA dashboard:
- A dynamic view of the total number of evaluated recordings, the average score calculated, evaluation forms being used, and more.
- The drill-down analytics capability allows you to instantly shift from an overview of data to a more detailed and granular view within the same dataset they are analyzing by navigating to a group/user level.
- Comparing metrics over time to instantly measure changes by highlighting differences between two identical timeframes.
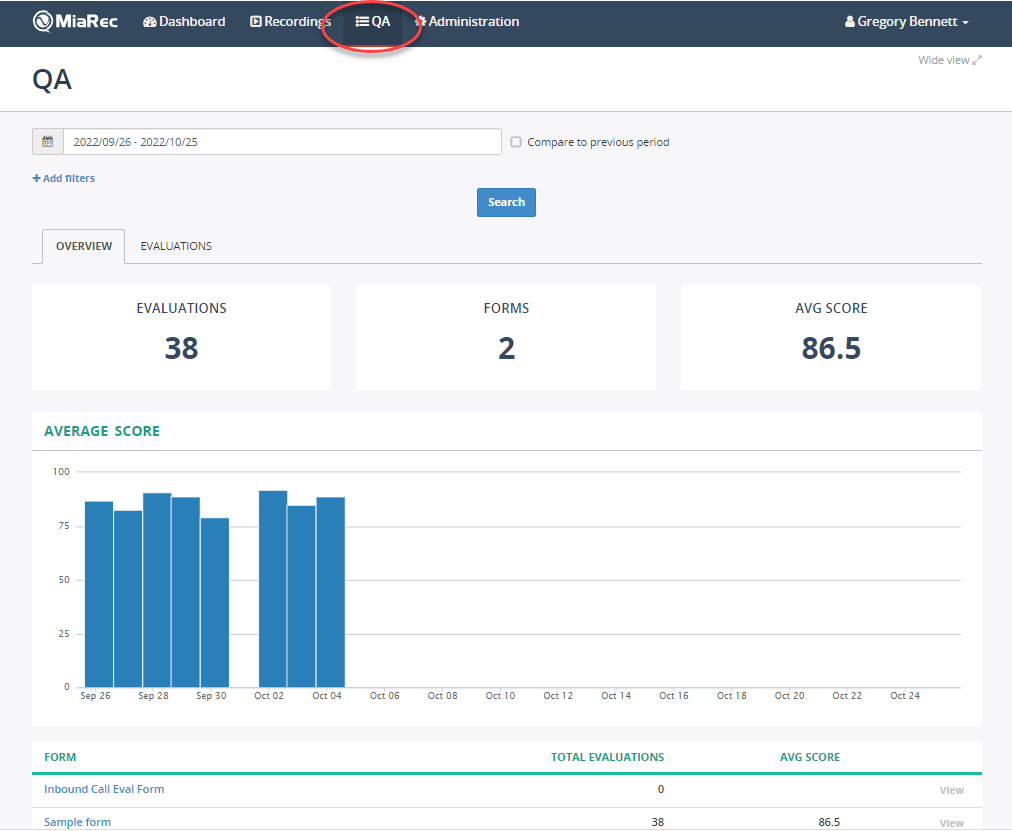
Overview Tab
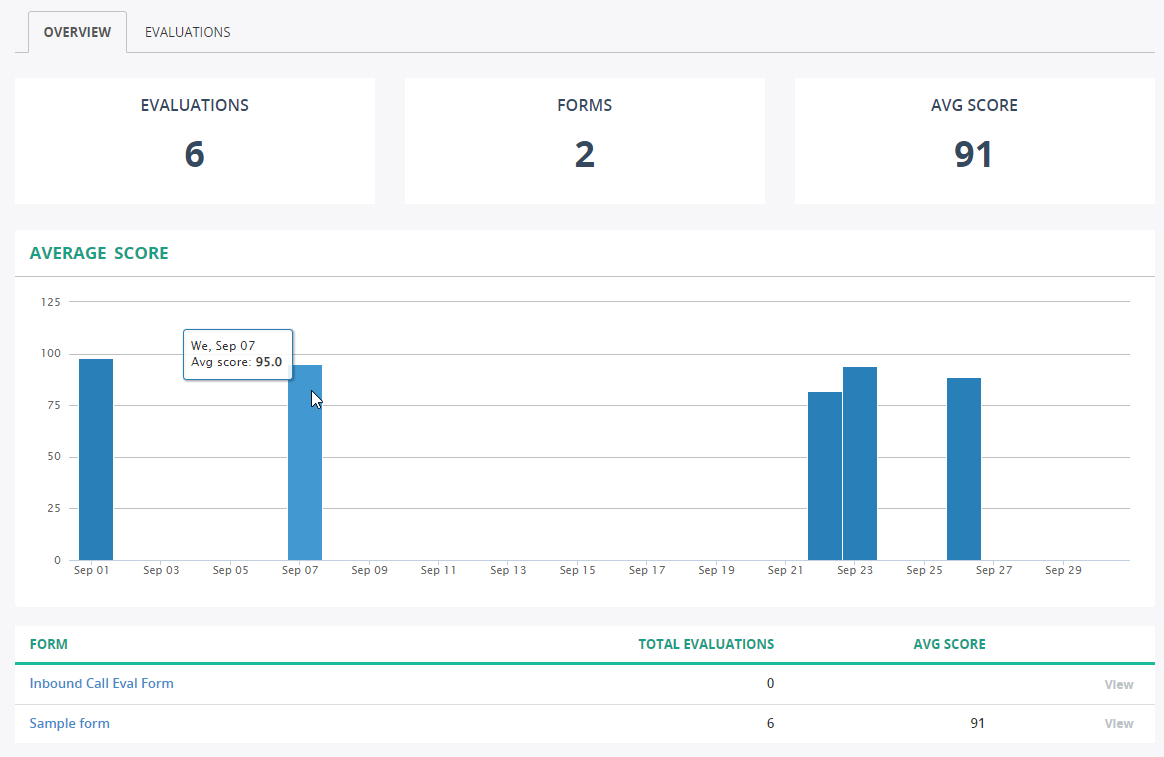
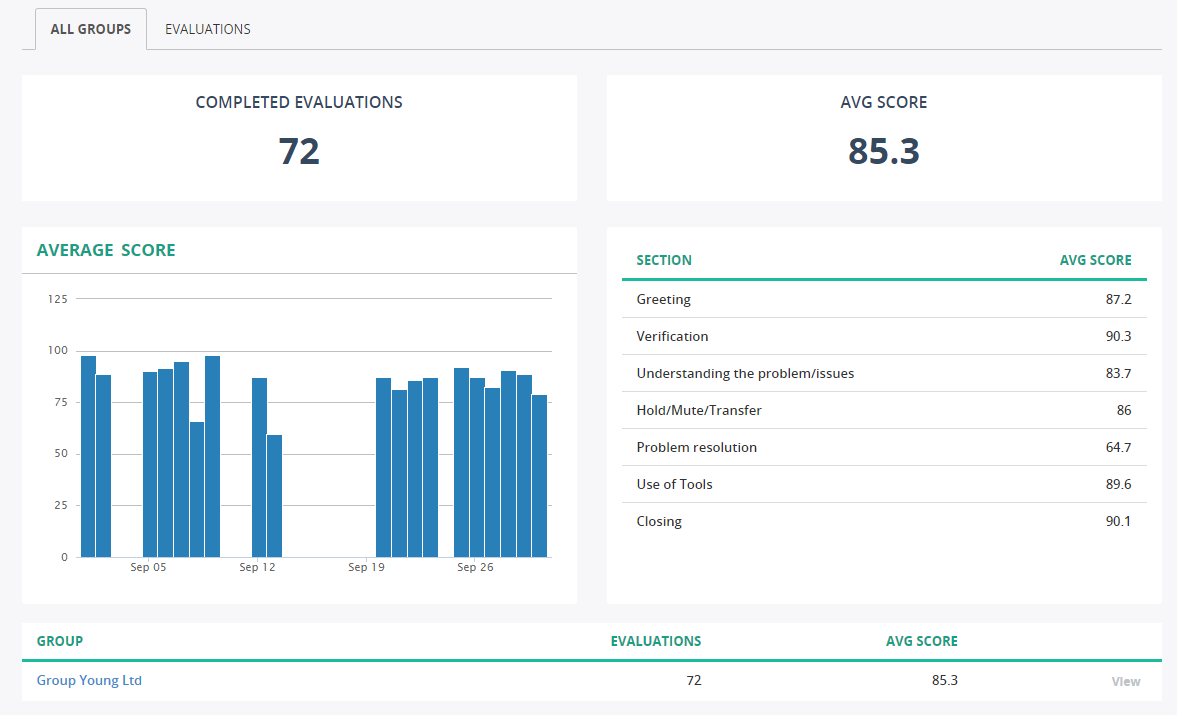
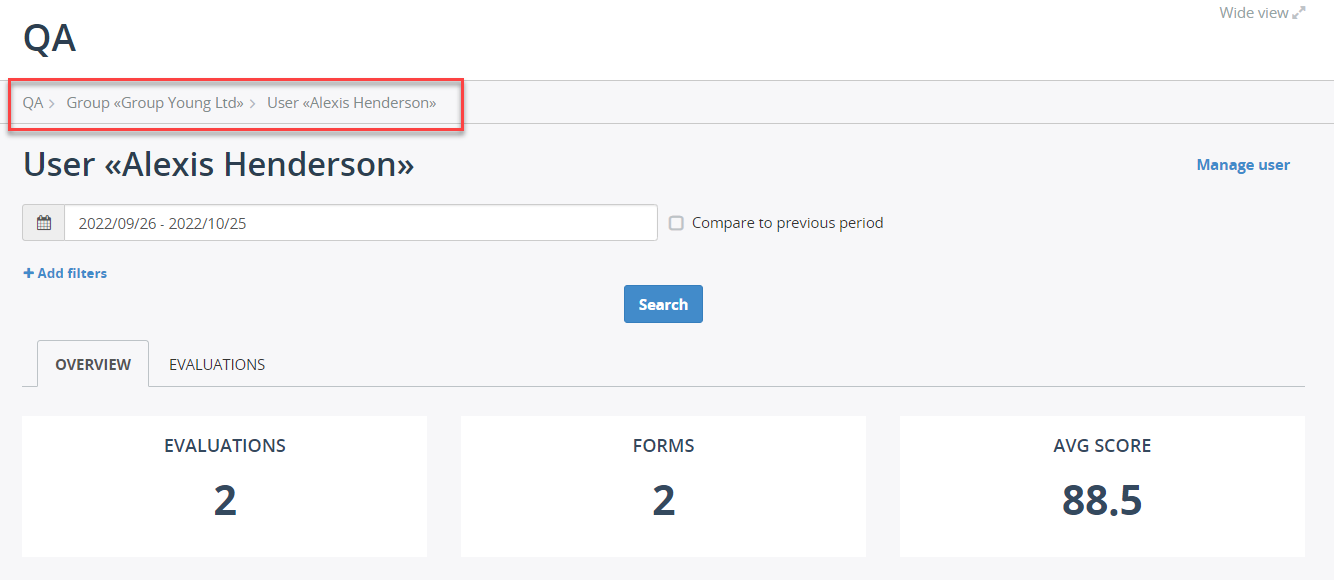
The Overview tab displays the summary chart with the evaluation performance and provides information about the total number of evaluated recordings, evaluation forms used, and average score calculated.
You can view the number of evaluations per day within the chart by hovering the cursor over a point on the graph.
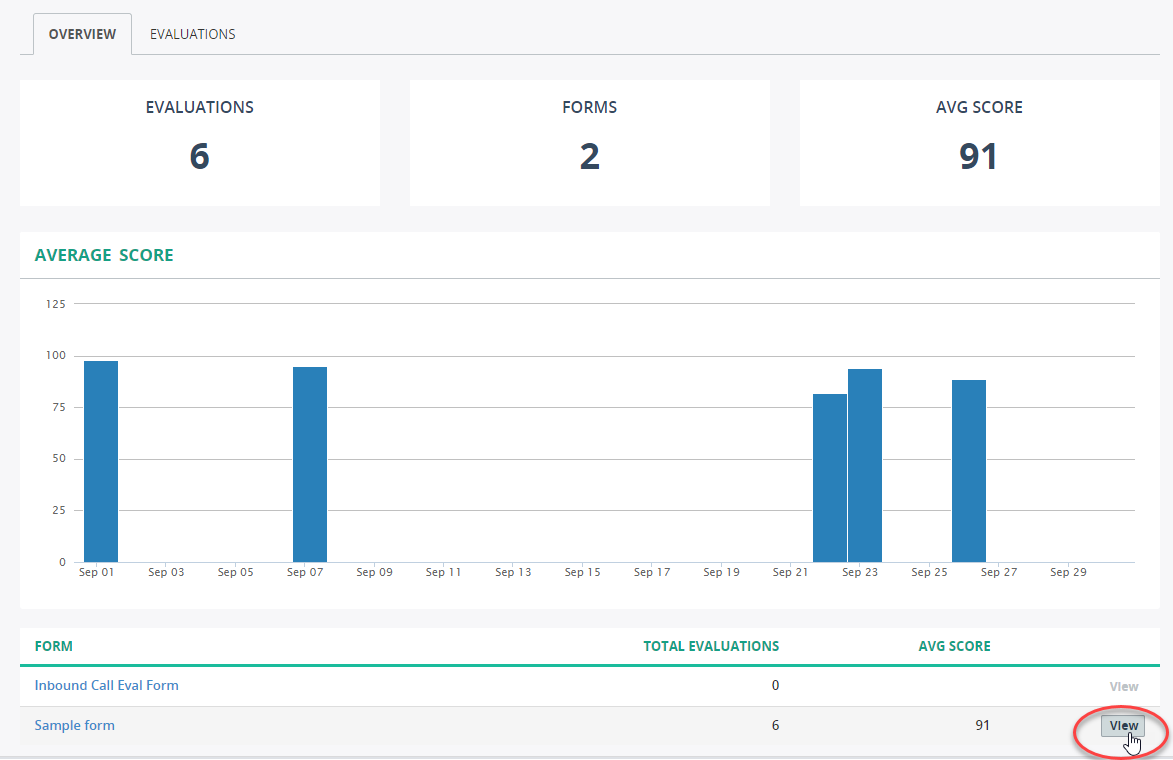
To view evaluation data based on a specific evaluation form used, click the form name at the bottom.
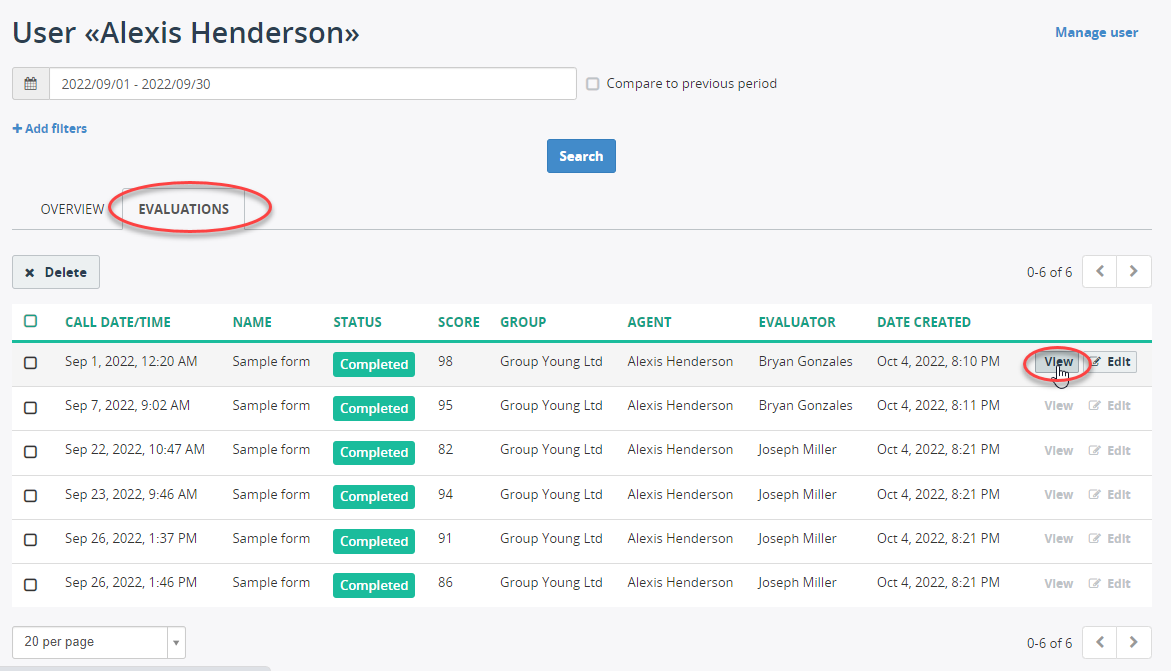
Evaluations Tab
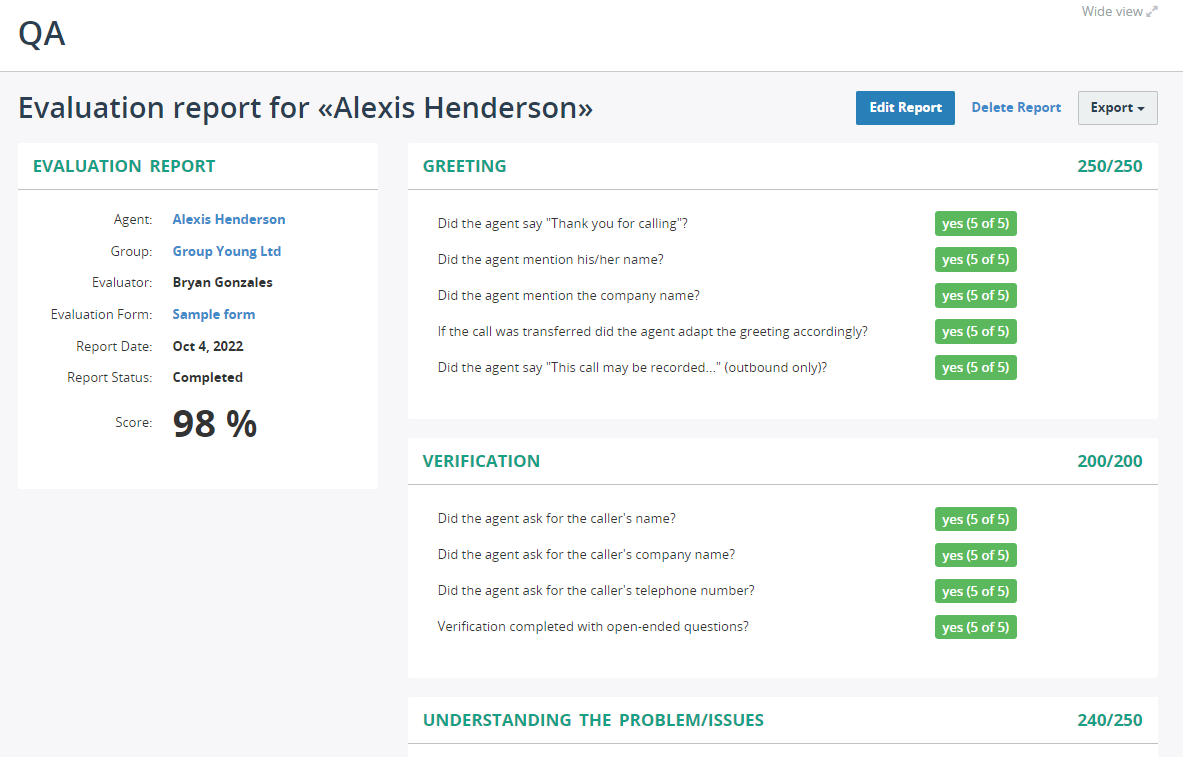
The Evaluations tab lists all evaluation reports being used for a specific group or user. You can open the most recent evaluation report by clicking the View button next to the report.
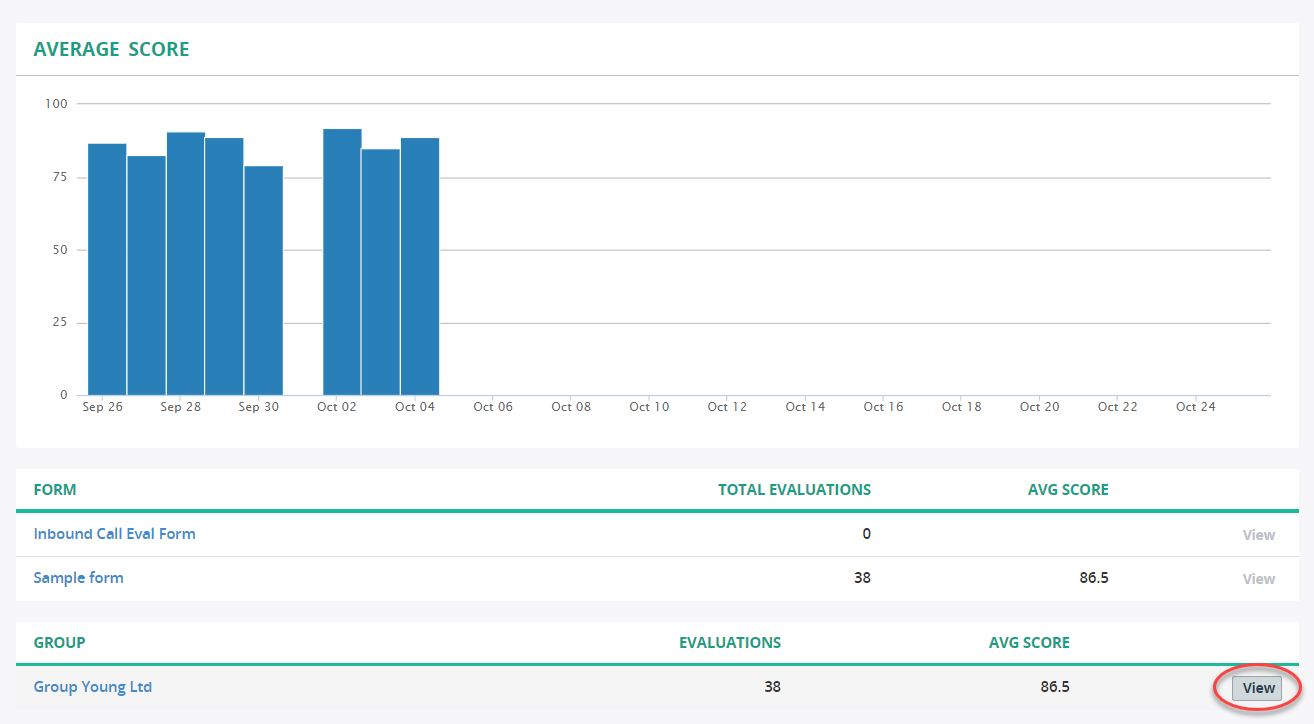
Drill-Down Capabilities
An intuitive graphical dashboard lets you quickly analyze group or user-level evaluation data.
To drill down dashboard data by groups and agents, scroll down to the table section and click the View button next to the group/user.
You can also use the breadcrumb trail to quickly move up to the higher-level page.
Select a date range
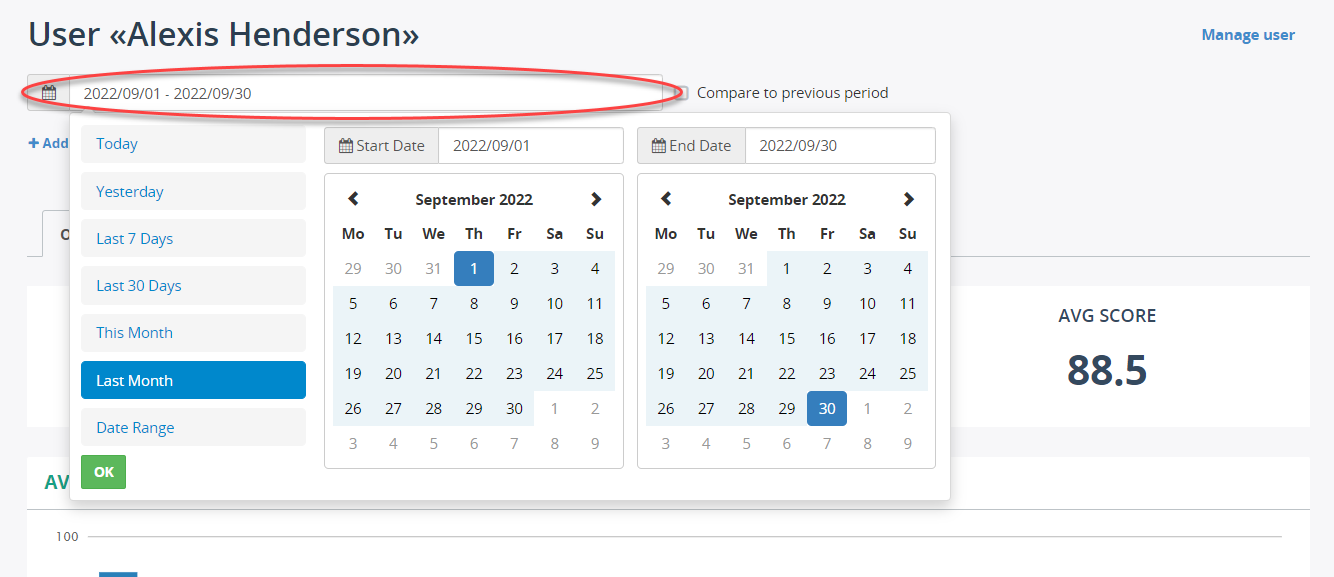
This search option lets you filter evaluation data within a specific range of dates.
To view the data by date range, click the date field and choose from one of the available options:
- Today
- Yesterday
- Last 7 Days
- Last 30 Days
- This Month
- Last Month
- Date Range
Compare to previous period
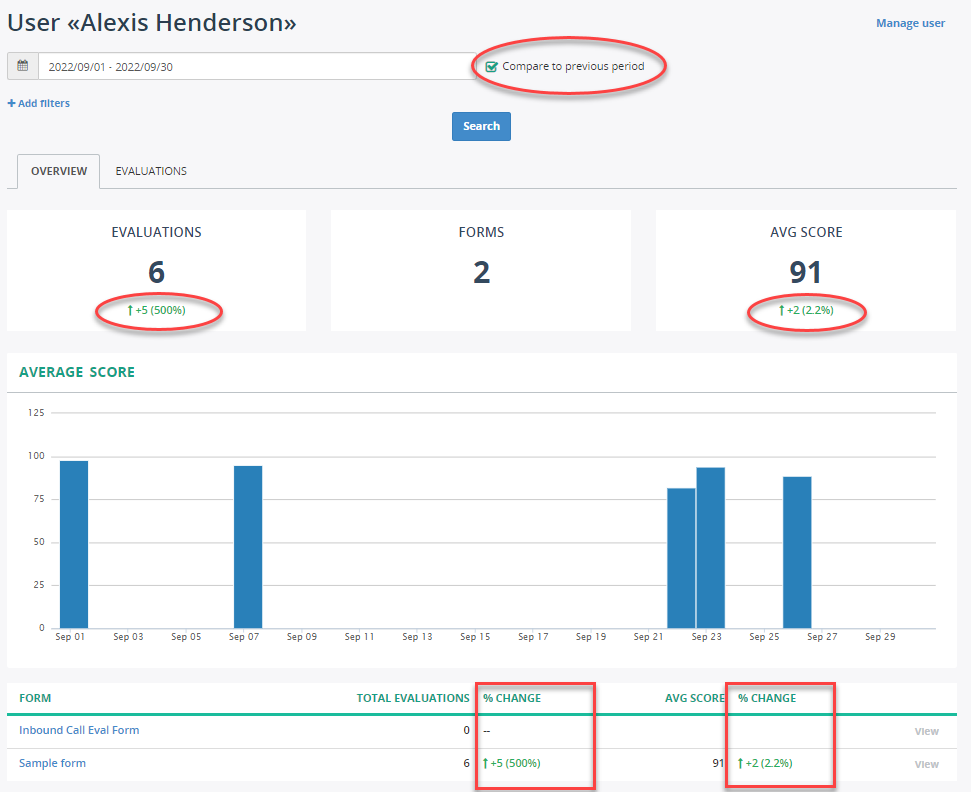
Comparing metrics over time is a great way to benchmark progress and identify issues as they come up.
If the Compare to previous period checkbox is selected, then all applicable metrics are calculated between two identical timeframes (for example between this week and a previous one) and a change in percentage is displayed.
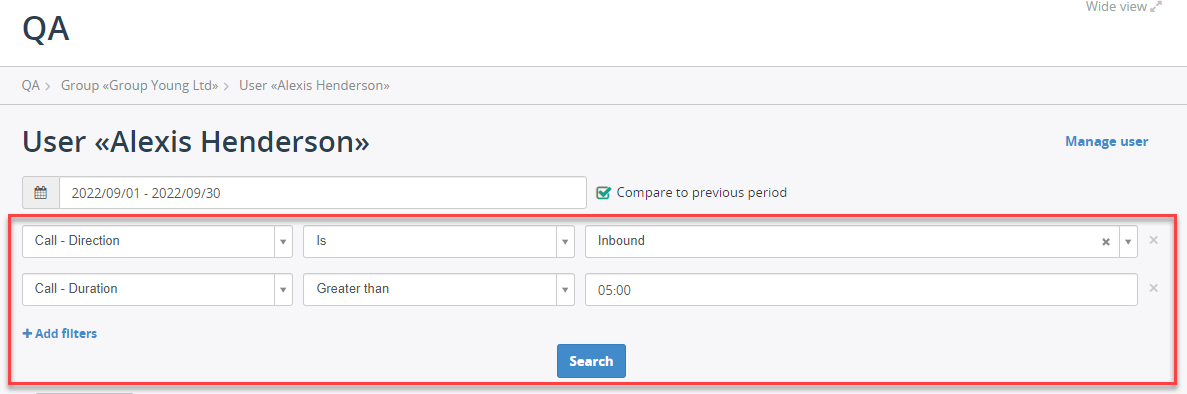
Add Filters
Optionally, you can click Add filters to filter the evaluation data based on specific recordings. For example, the data based on call recordings by direction (only inbound calls) and duration (between 0:15 and 5:00).