Reports
Reports answer the questions dashboards do not: they let you pick exact columns, group and sort the data your way, export it to Excel or PDF, and deliver it by email on a schedule. Dashboards are the place for live, interactive monitoring; reports are the place for ad-hoc analysis and recurring deliverables.
A report in MiaRec is a saved definition — a template describing the layout, filters, and schedule — plus the history of its runs. You run a report to produce results for a chosen period.
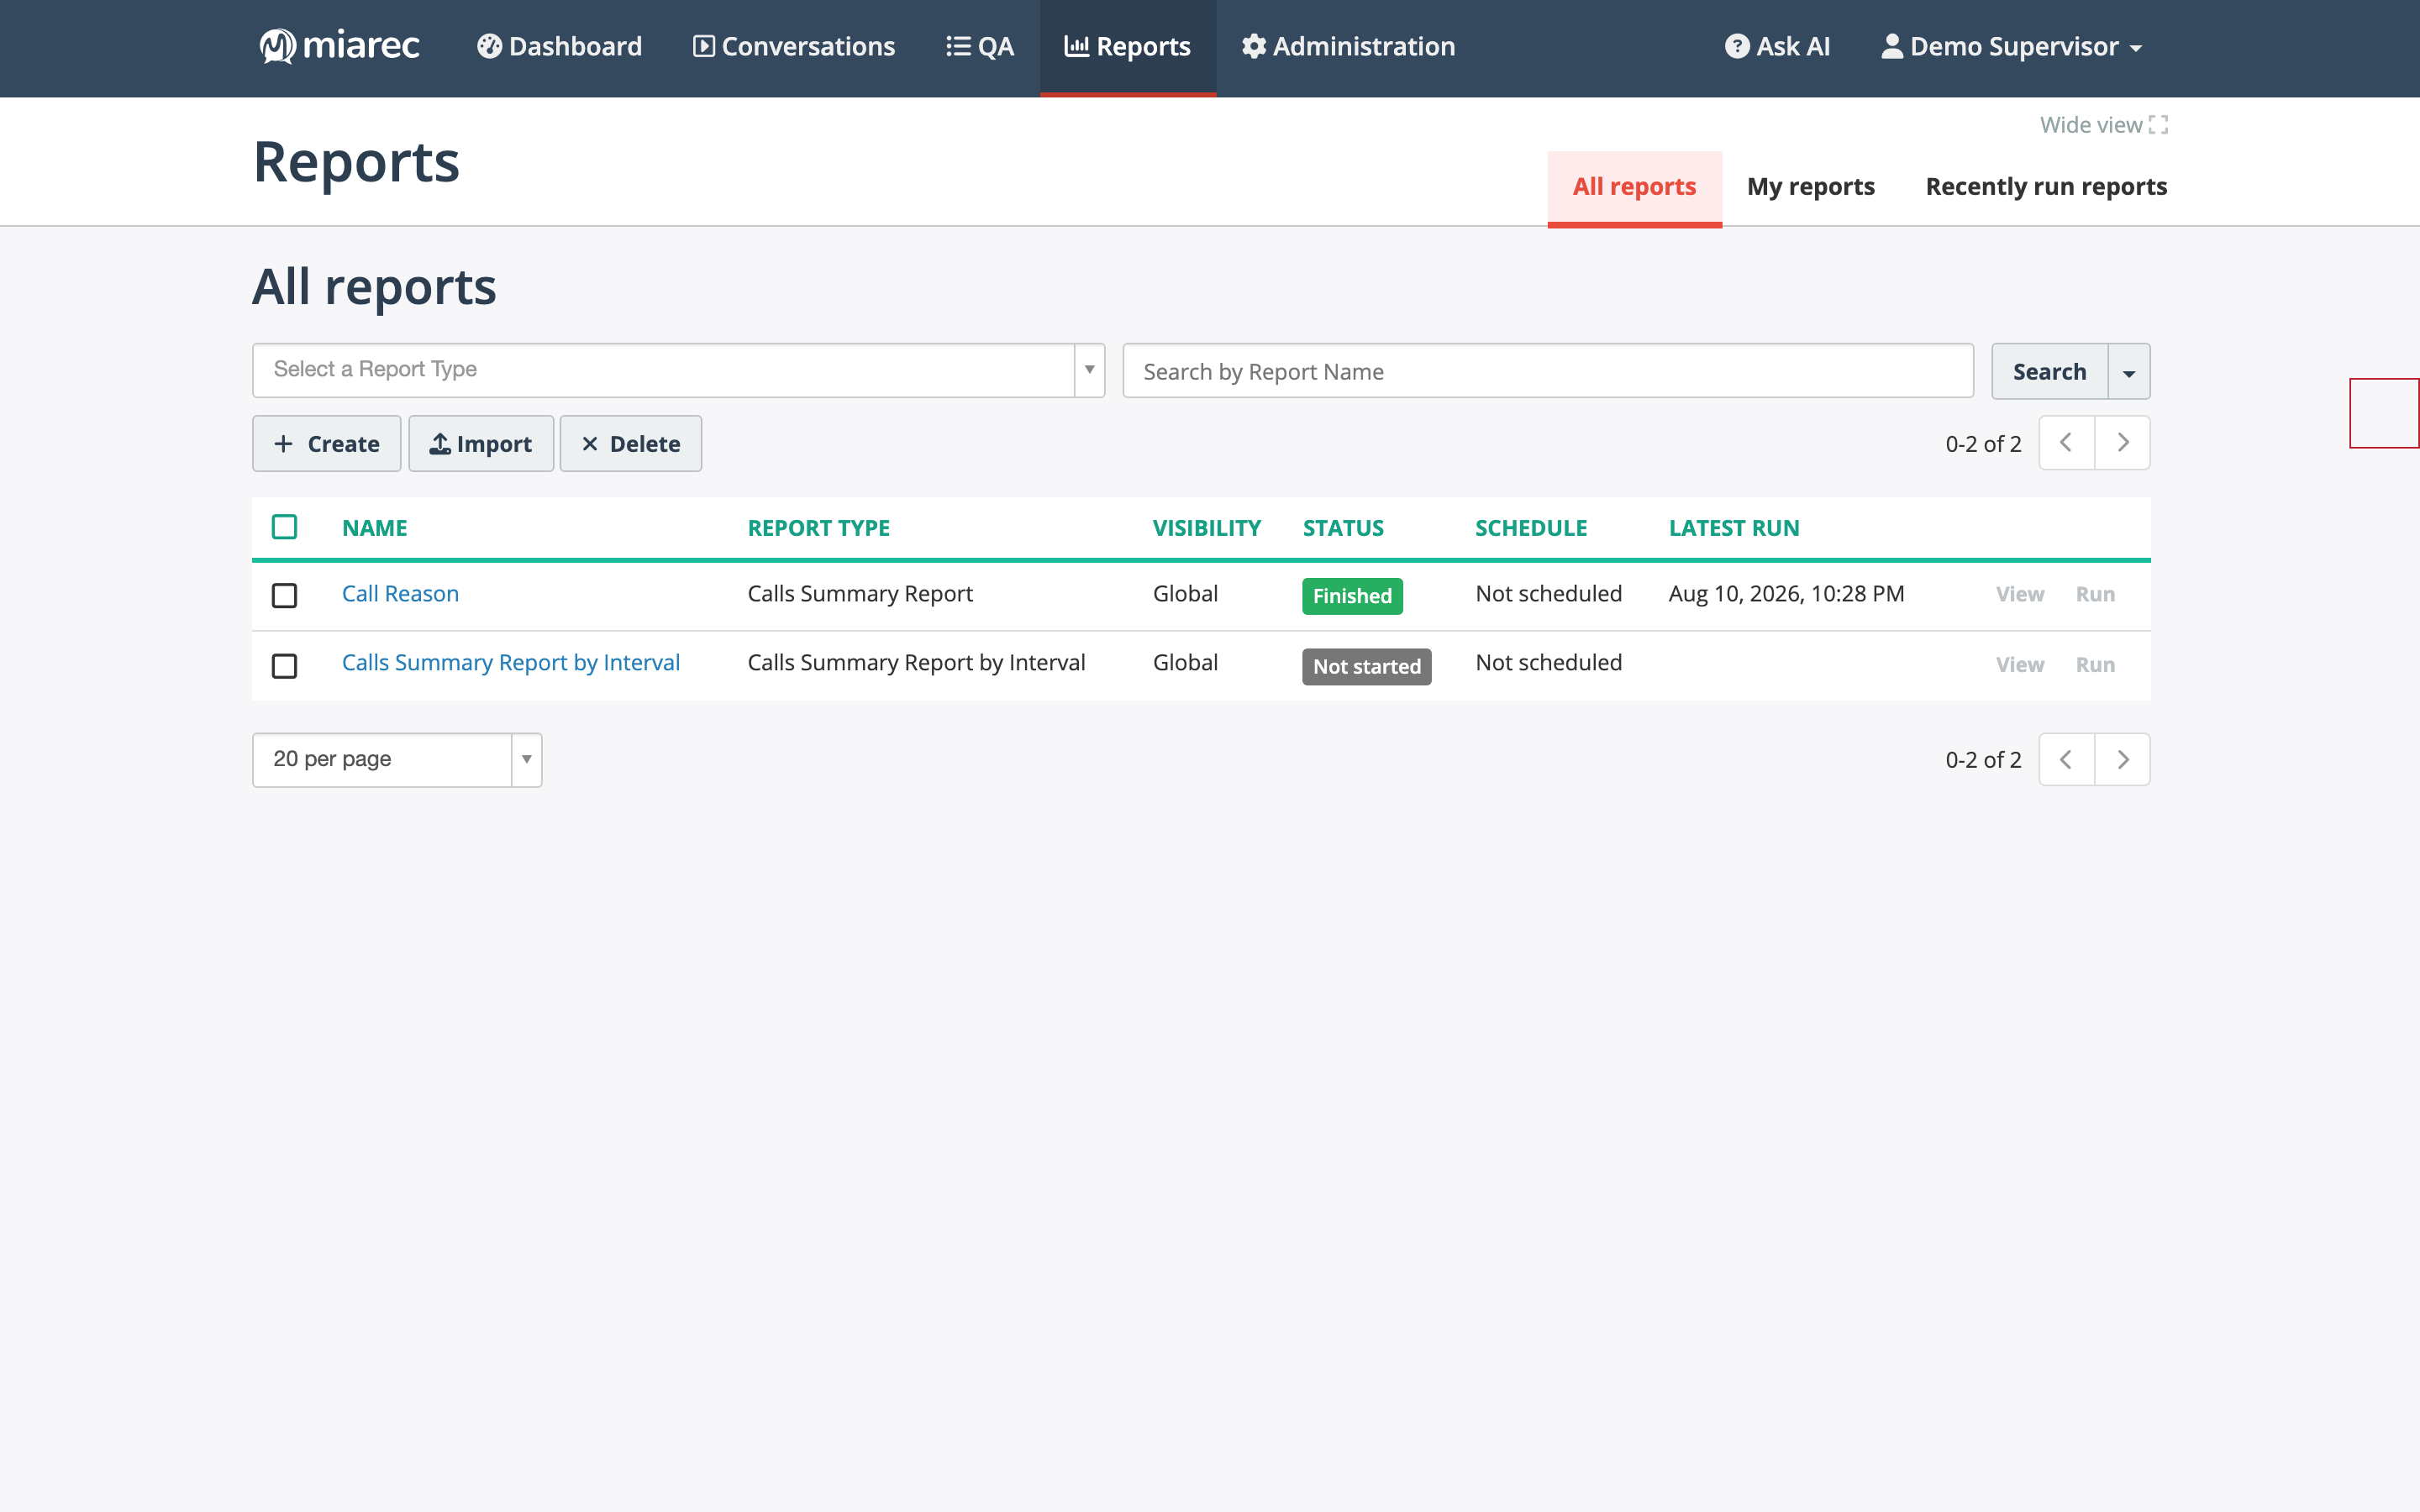
The Reports library: each row is a report with its type, visibility, status, schedule, and latest run. Use Create to build a new report, Import to load a template from an XML file.
Report groups
The Reports page organizes reports into groups, shown as tabs:
- All reports — every report you are allowed to see.
- My reports — reports you created.
- Recently run reports — reports with recent runs, for quick access.
Use the report-type selector and the name search above the list to find a report.
Report types
When you create a report, you choose its type. Types available to users of your organization include:
- Call Details Report — one row per conversation, with configurable columns. See Conversation details report.
- Calls Summary Report and its variants by Group, by Users, and by Interval — aggregated totals. See Conversation summary reports.
- User Details Report — one row per user account; typically used by administrators.
- Audit Trail Details / Summary Report — audit-trail reporting; see Audit reports in the Administration Guide.
In this chapter
- Report templates — what a template defines.
- Creating report templates — the full template reference.
- Managing templates — edit, clone, export/import, delete.
- Running reports — on-demand runs and schedules.
- Viewing reports — finding runs and results; deleting.
- Exporting report data — Excel/PDF export and email delivery.
- Conversation details report — the per-conversation report type.
- Conversation summary reports — the summary report family.
- Column reference — every available column, including AI analytics columns.