Topic dashboards
The Topics tab shows what your customers talk about: how conversations distribute across the topics your organization has defined, and how each topic trends over time. What a topic is and how detection works is explained in Conversation Analytics.
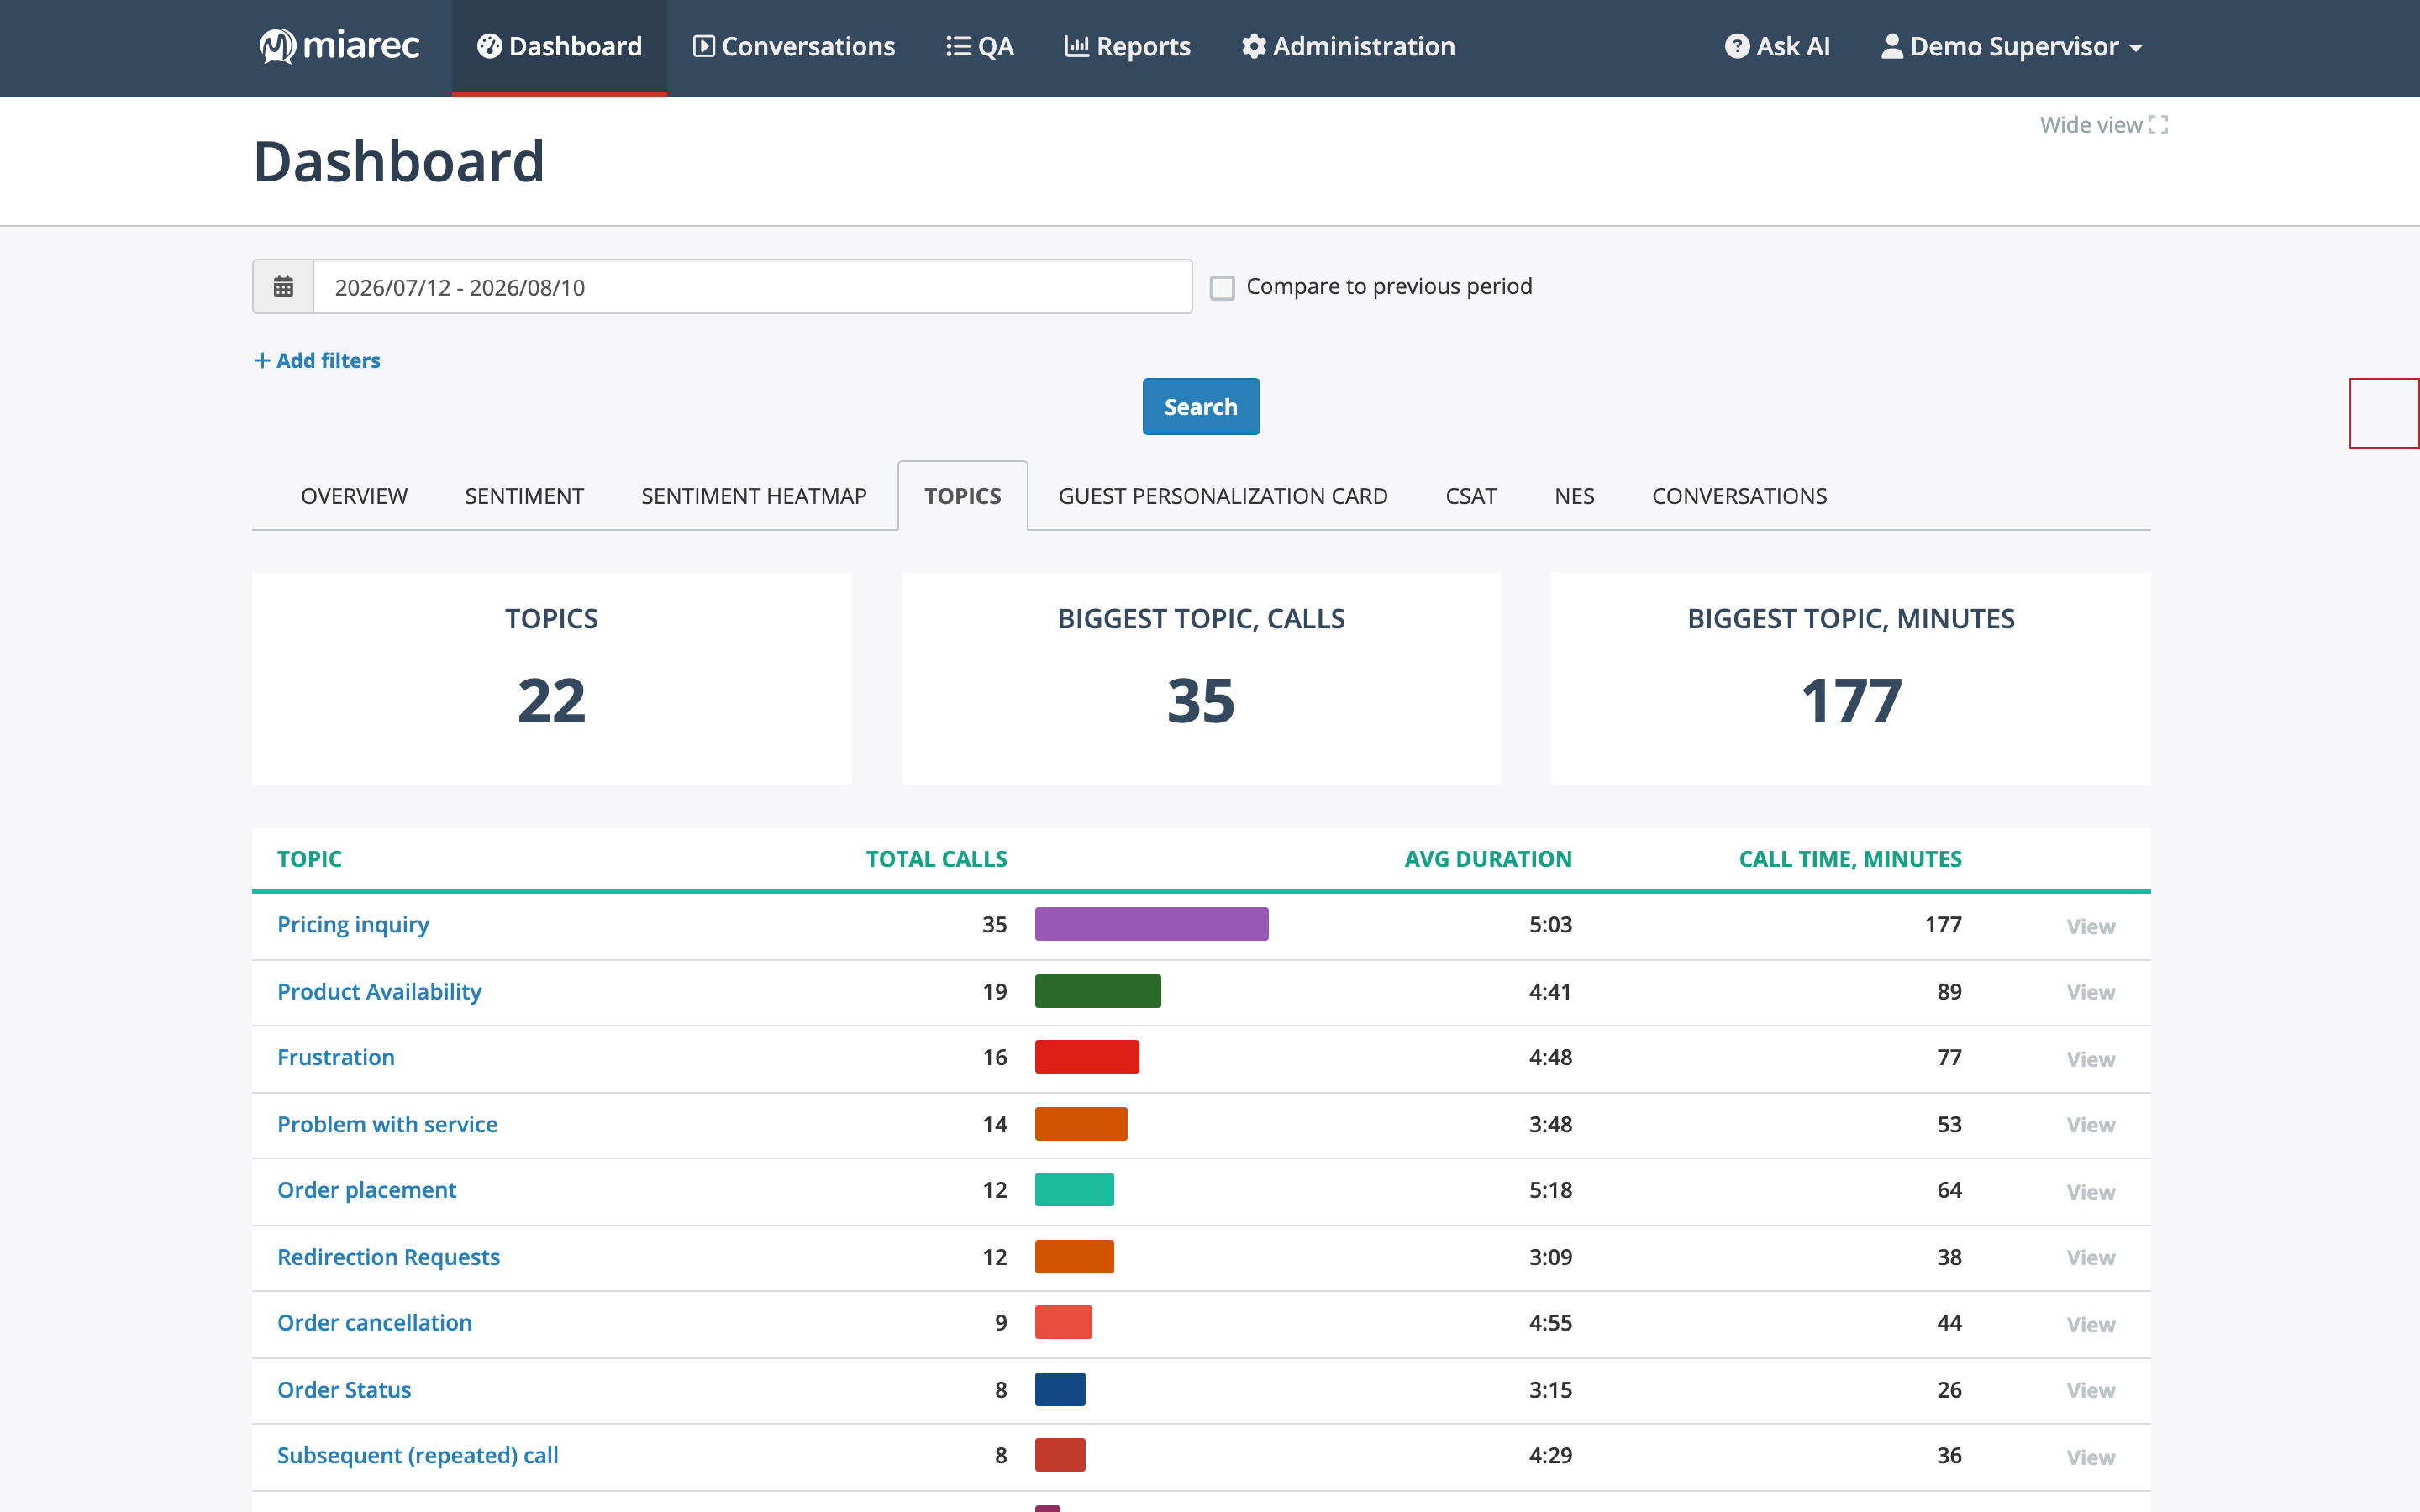
The Topics tab. Notice the counters at the top and the per-topic table sorted by conversation count — the biggest topics are immediately visible.
Topic distribution
For the selected period, the Topics tab shows:
- Counters — the number of topics detected, plus the size of the biggest topic by conversation count and by minutes.
- Per-topic table — one row per topic, sorted with the most frequent topic first: total conversations (with a proportional bar in the topic's color), average duration, and total talk time.
Because one conversation can match several topics, the table counts a conversation under every topic it matched.
Per-topic trends
Click a topic name (or its View button) to drill down to that topic's own dashboard. The topic dashboard shows the topic's trend over time — useful for questions like "are cancellation conversations growing this month?" — and a Conversations tab listing the conversations that matched the topic, so you can listen to examples directly. Use the breadcrumbs to return to the full topic list; see Drilling down.
Info
Topics are defined by your administrator, and only conversations analyzed for topics are counted here. If the tab is empty or a subject you expect is missing, topic analysis may not be enabled or no topic is defined for it — see Configuring topics in the Administration Guide.
Related pages
- Topics on conversations — where topics appear on individual conversations and in search.
- Filtering dashboard data — date ranges and filters.