Cross-tenant dashboard
Users with cross-tenant visibility land on the Tenants dashboard after signing in — an aggregate view
of activity across every tenant, at Dashboard (/dashboard/tenants/overview). It is the only
operator-specific dashboard; drilling into a tenant opens the same analytics dashboards that tenant's own
administrators see.
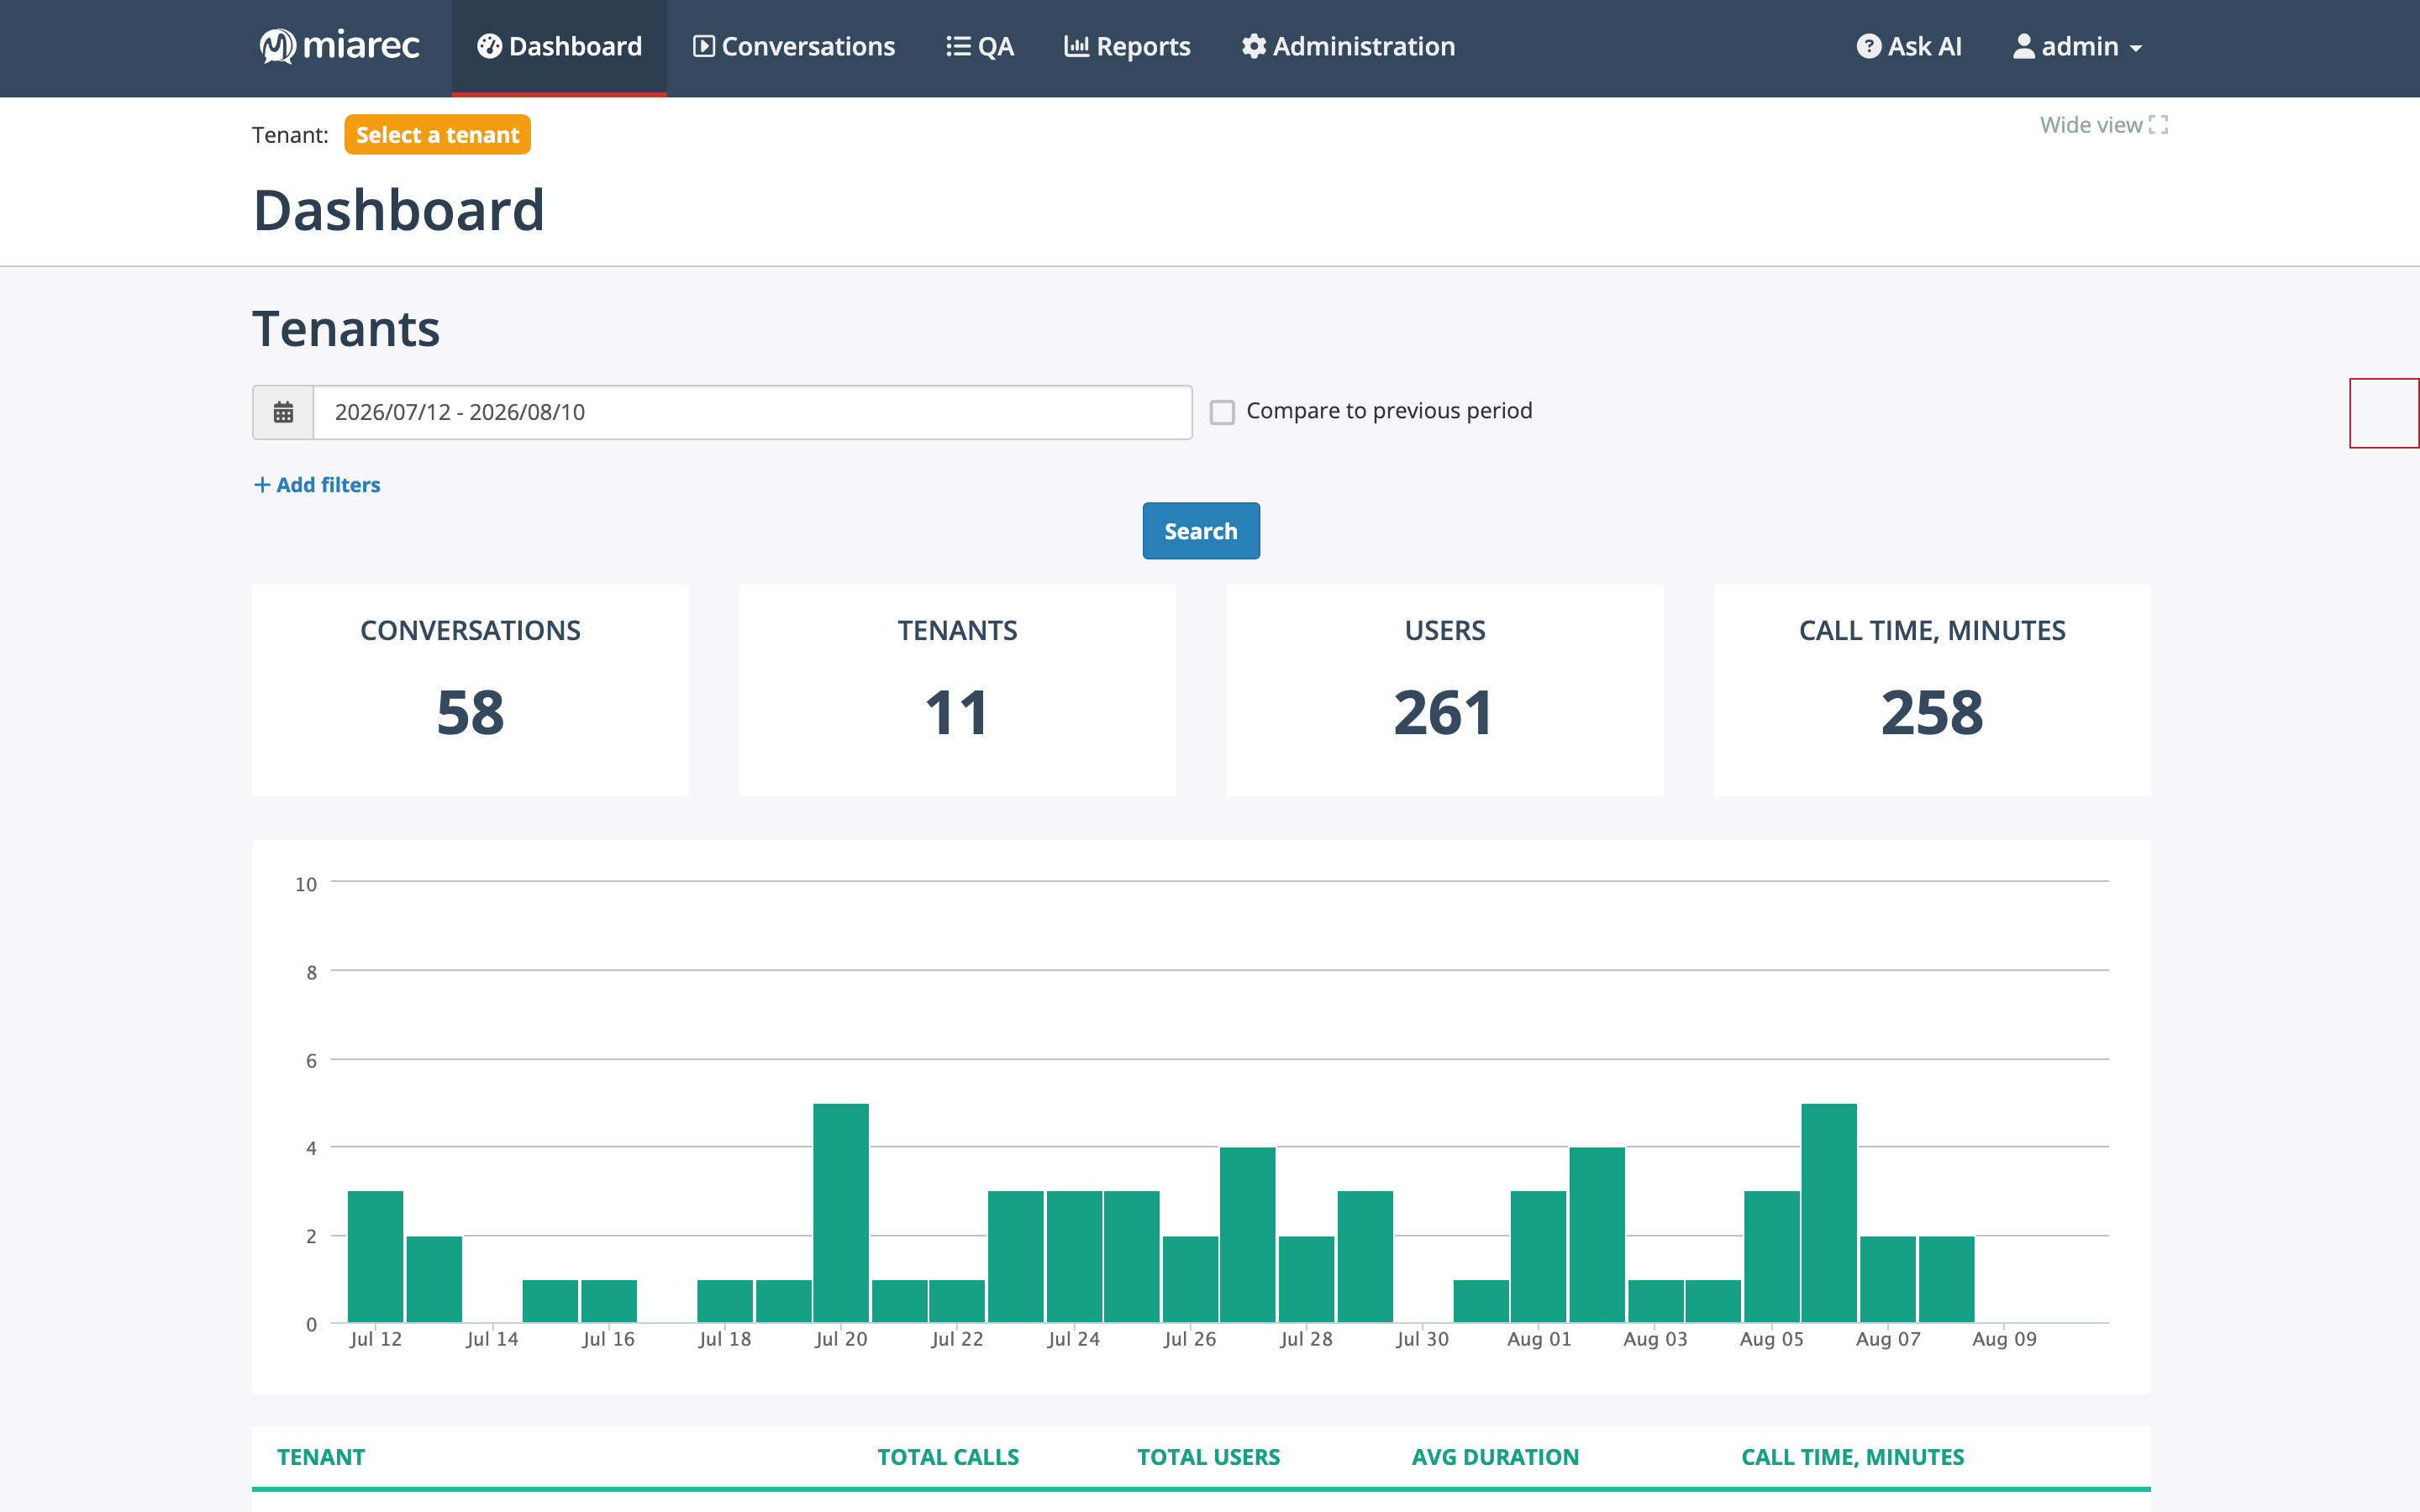
The Tenants dashboard: KPI tiles for Conversations, Tenants, Users, and Call time; the daily conversation trend; and (below) the per-tenant table. The date filter and "Compare to previous period" apply to the whole page.
What the page shows
- KPI tiles — Conversations, Tenants, Users, and Call time, minutes for the selected period. With Compare to previous period checked, the conversation and call-time tiles show the change against the preceding period of the same length.
- Trend chart — conversations per day across all tenants.
- Per-tenant table — one row per tenant with Total calls, Total users, Avg duration, and Call time, minutes. Click a tenant to drill into its dashboard.
The date filter defaults to the system's default date filter (see Advanced settings); Add filters narrows the data with the same advanced filters used elsewhere.
Panels are computed by background tasks and cached for a few minutes, so tiles can briefly show a loading state and numbers can lag real time slightly.
Drilling down
Selecting a tenant opens that tenant's analytics dashboard — overview, sentiment, sentiment heatmap, topics, and conversations tabs — described in the User Guide dashboards chapter. The QA dashboard has a matching cross-tenant entry point that lists tenants with their evaluation totals before drilling into a tenant's QA overview.
Tip
For numbers you need as a document rather than a page — per-tenant call volumes, storage usage — use the tenant reports instead; they export to XLSX/PDF and can include storage and license columns the dashboard does not show.
Related pages
- Tenant reports — the reporting counterpart of this dashboard.
- View-as and impersonation — inspecting a tenant's data beyond dashboards.