Product tour
This page is a quick orientation to the MiaRec web portal: what each section of the navigation menu does, and how the portal differs for supervisors and agents.
The navigation menu
The menu at the top of every page gives you access to the main sections of the portal:
- Dashboard — analytics dashboards: conversation volume, sentiment, topics, and customer-experience metrics. See Dashboards.
- Conversations — the conversation lists, with playback, transcripts, search, and all per-conversation tools. See Browsing conversations.
- QA — quality assurance: evaluation dashboards, evaluations, and scorecards. See Quality Assurance.
- Reports — building and running reports. See Reports.
- Administration — configuration of your organization; visible only to users with administrative permissions. Covered by the Administration Guide.
Your name in the top-right corner opens the profile menu, with links to your personal settings — language, timezone, password, and account security. See My profile.
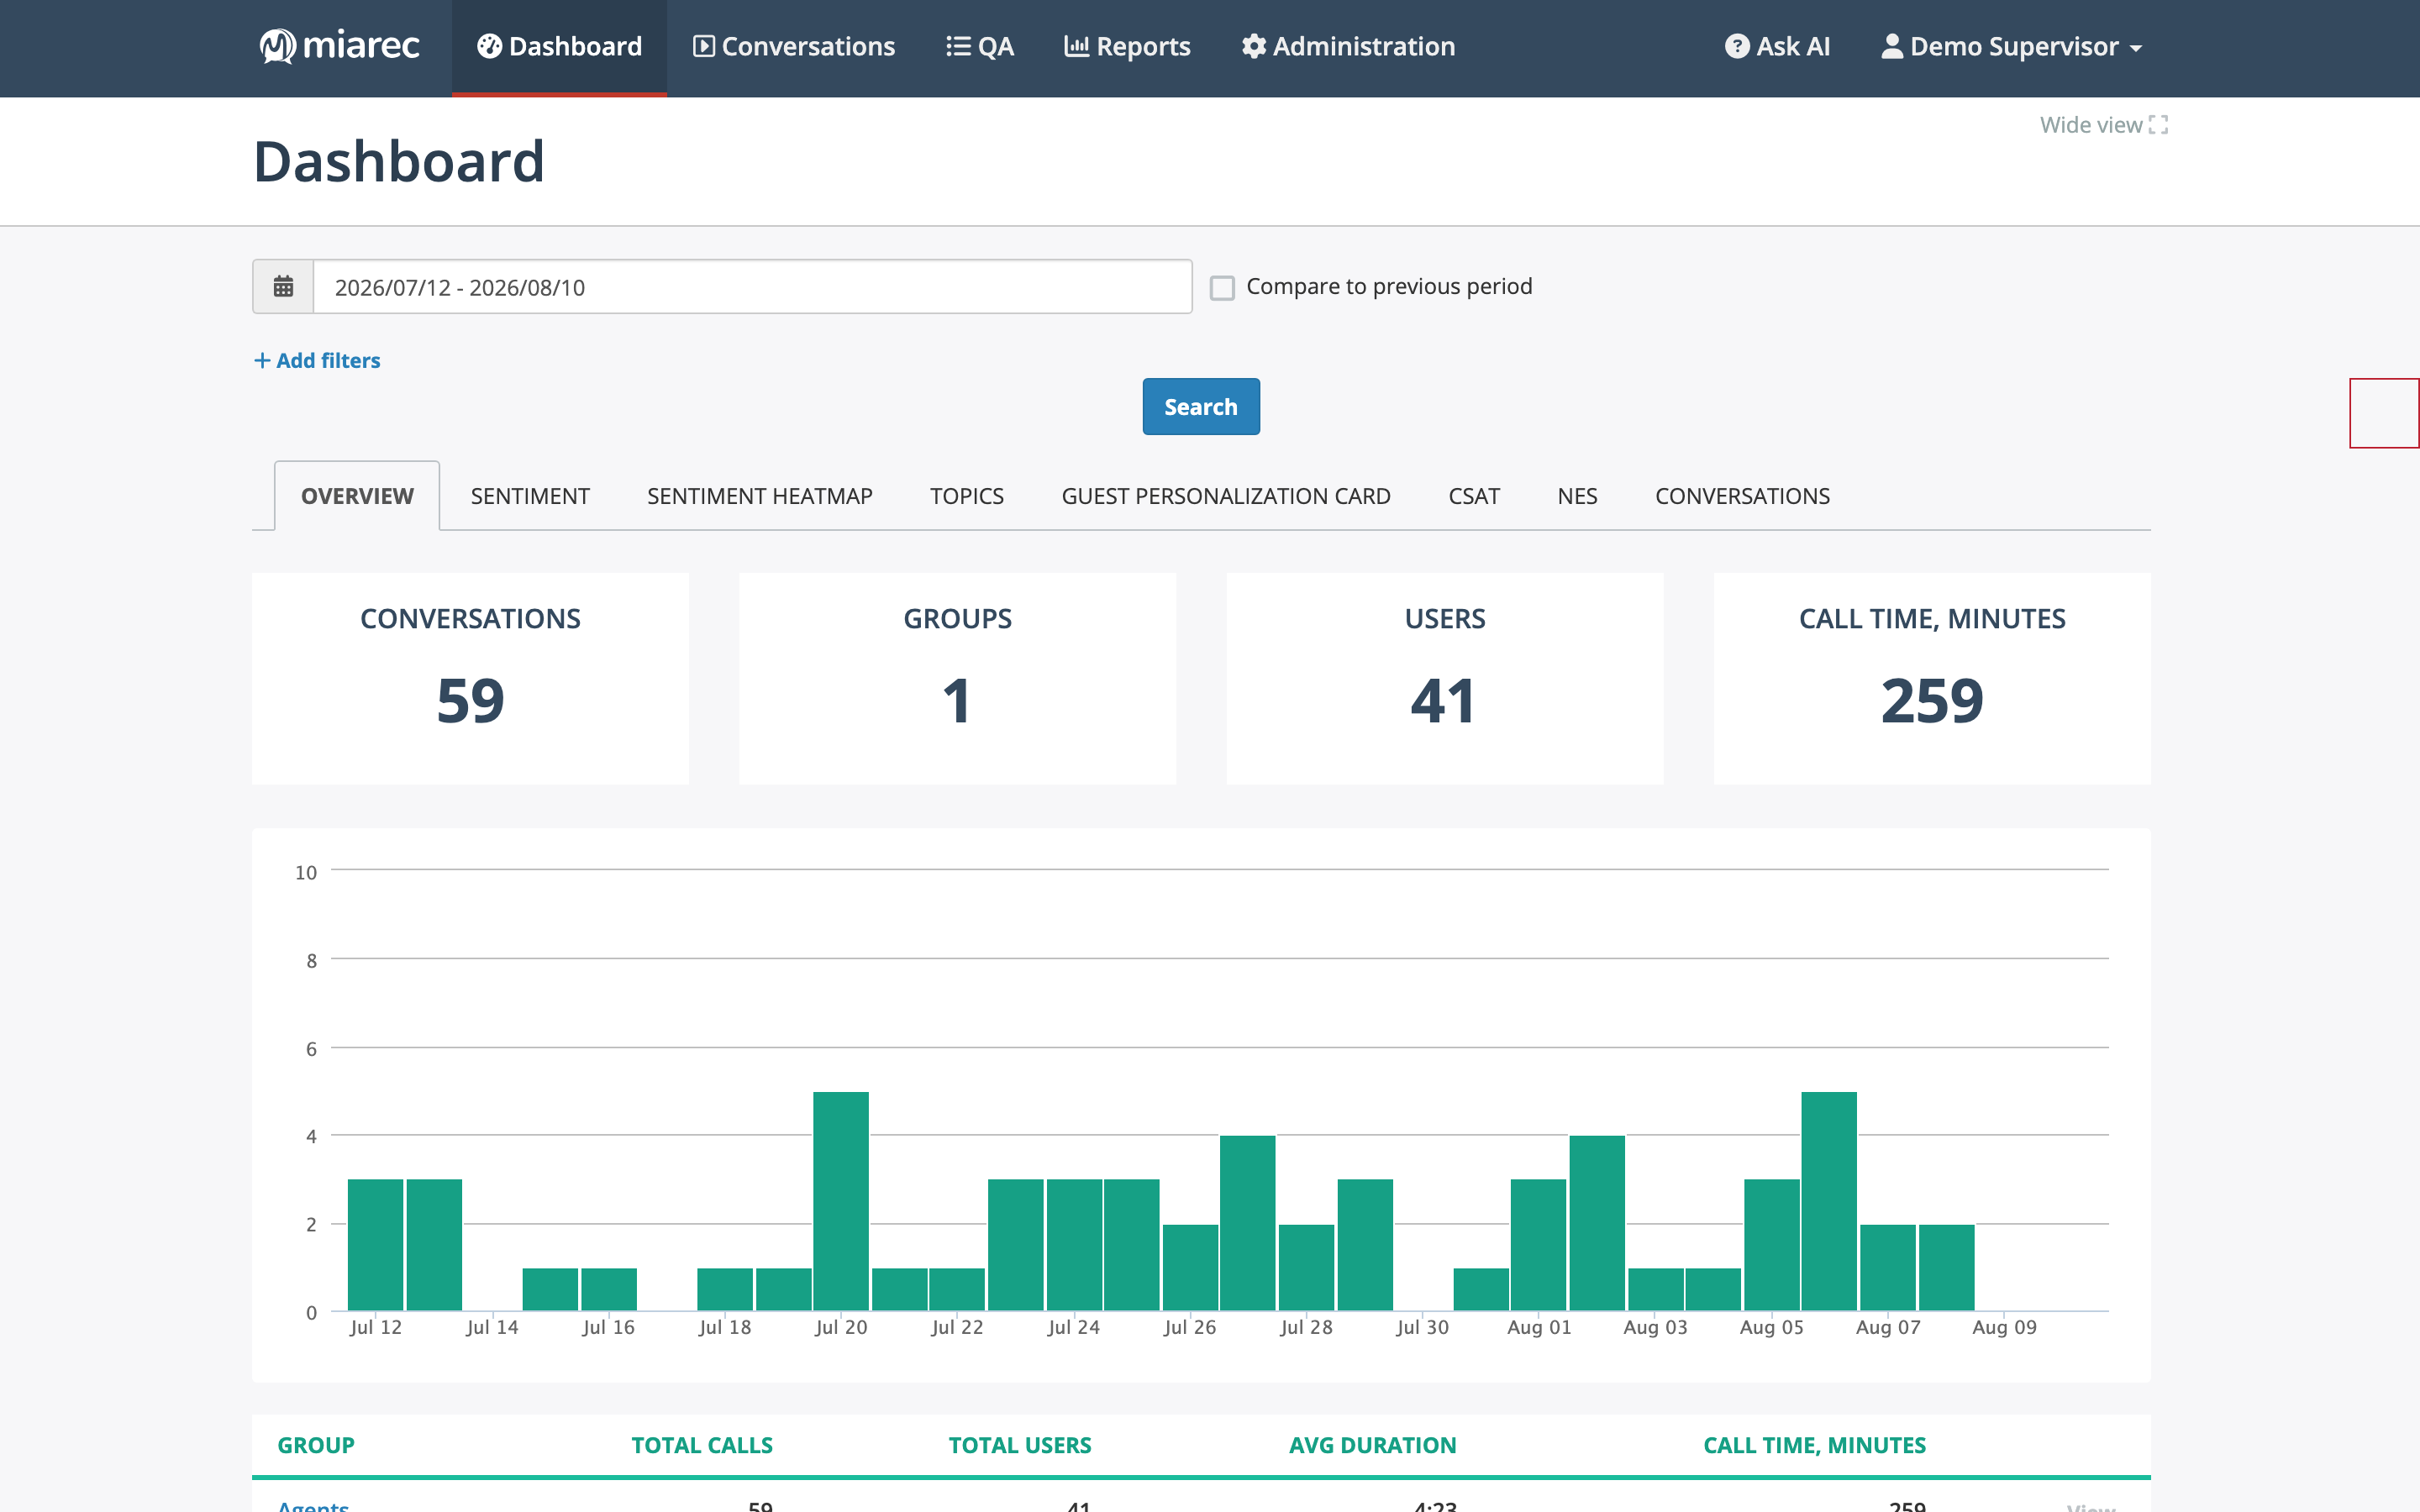
The portal as a supervisor sees it. Notice the full navigation menu at the top and the dashboard tabs — signing in lands you on the Dashboard page scoped to your data.
Info
Some menu items and tabs may not be visible to you. What you see depends on your role, permissions, and your organization's subscription — see People & Access.
What supervisors see vs what agents see
The portal adjusts to your access scope. A supervisor works with the data of the groups they manage; an agent works with their own conversations only.
| Area | Supervisor | Agent |
|---|---|---|
| Dashboard | Organization- and team-level dashboards with all tabs (sentiment, heatmap, topics, metrics) | Personal dashboard with Overview and Conversations tabs |
| Conversations | Team conversations; the By User tab with a group picker | Own conversations only |
| QA | Overview, Evaluations, and Scorecards; can edit evaluations | Overview and Evaluations; view-only access to own evaluations |
| Reports | Create and run reports over team data | Create and run reports over own data |
| Administration | Visible if the role includes administrative permissions | Not visible |
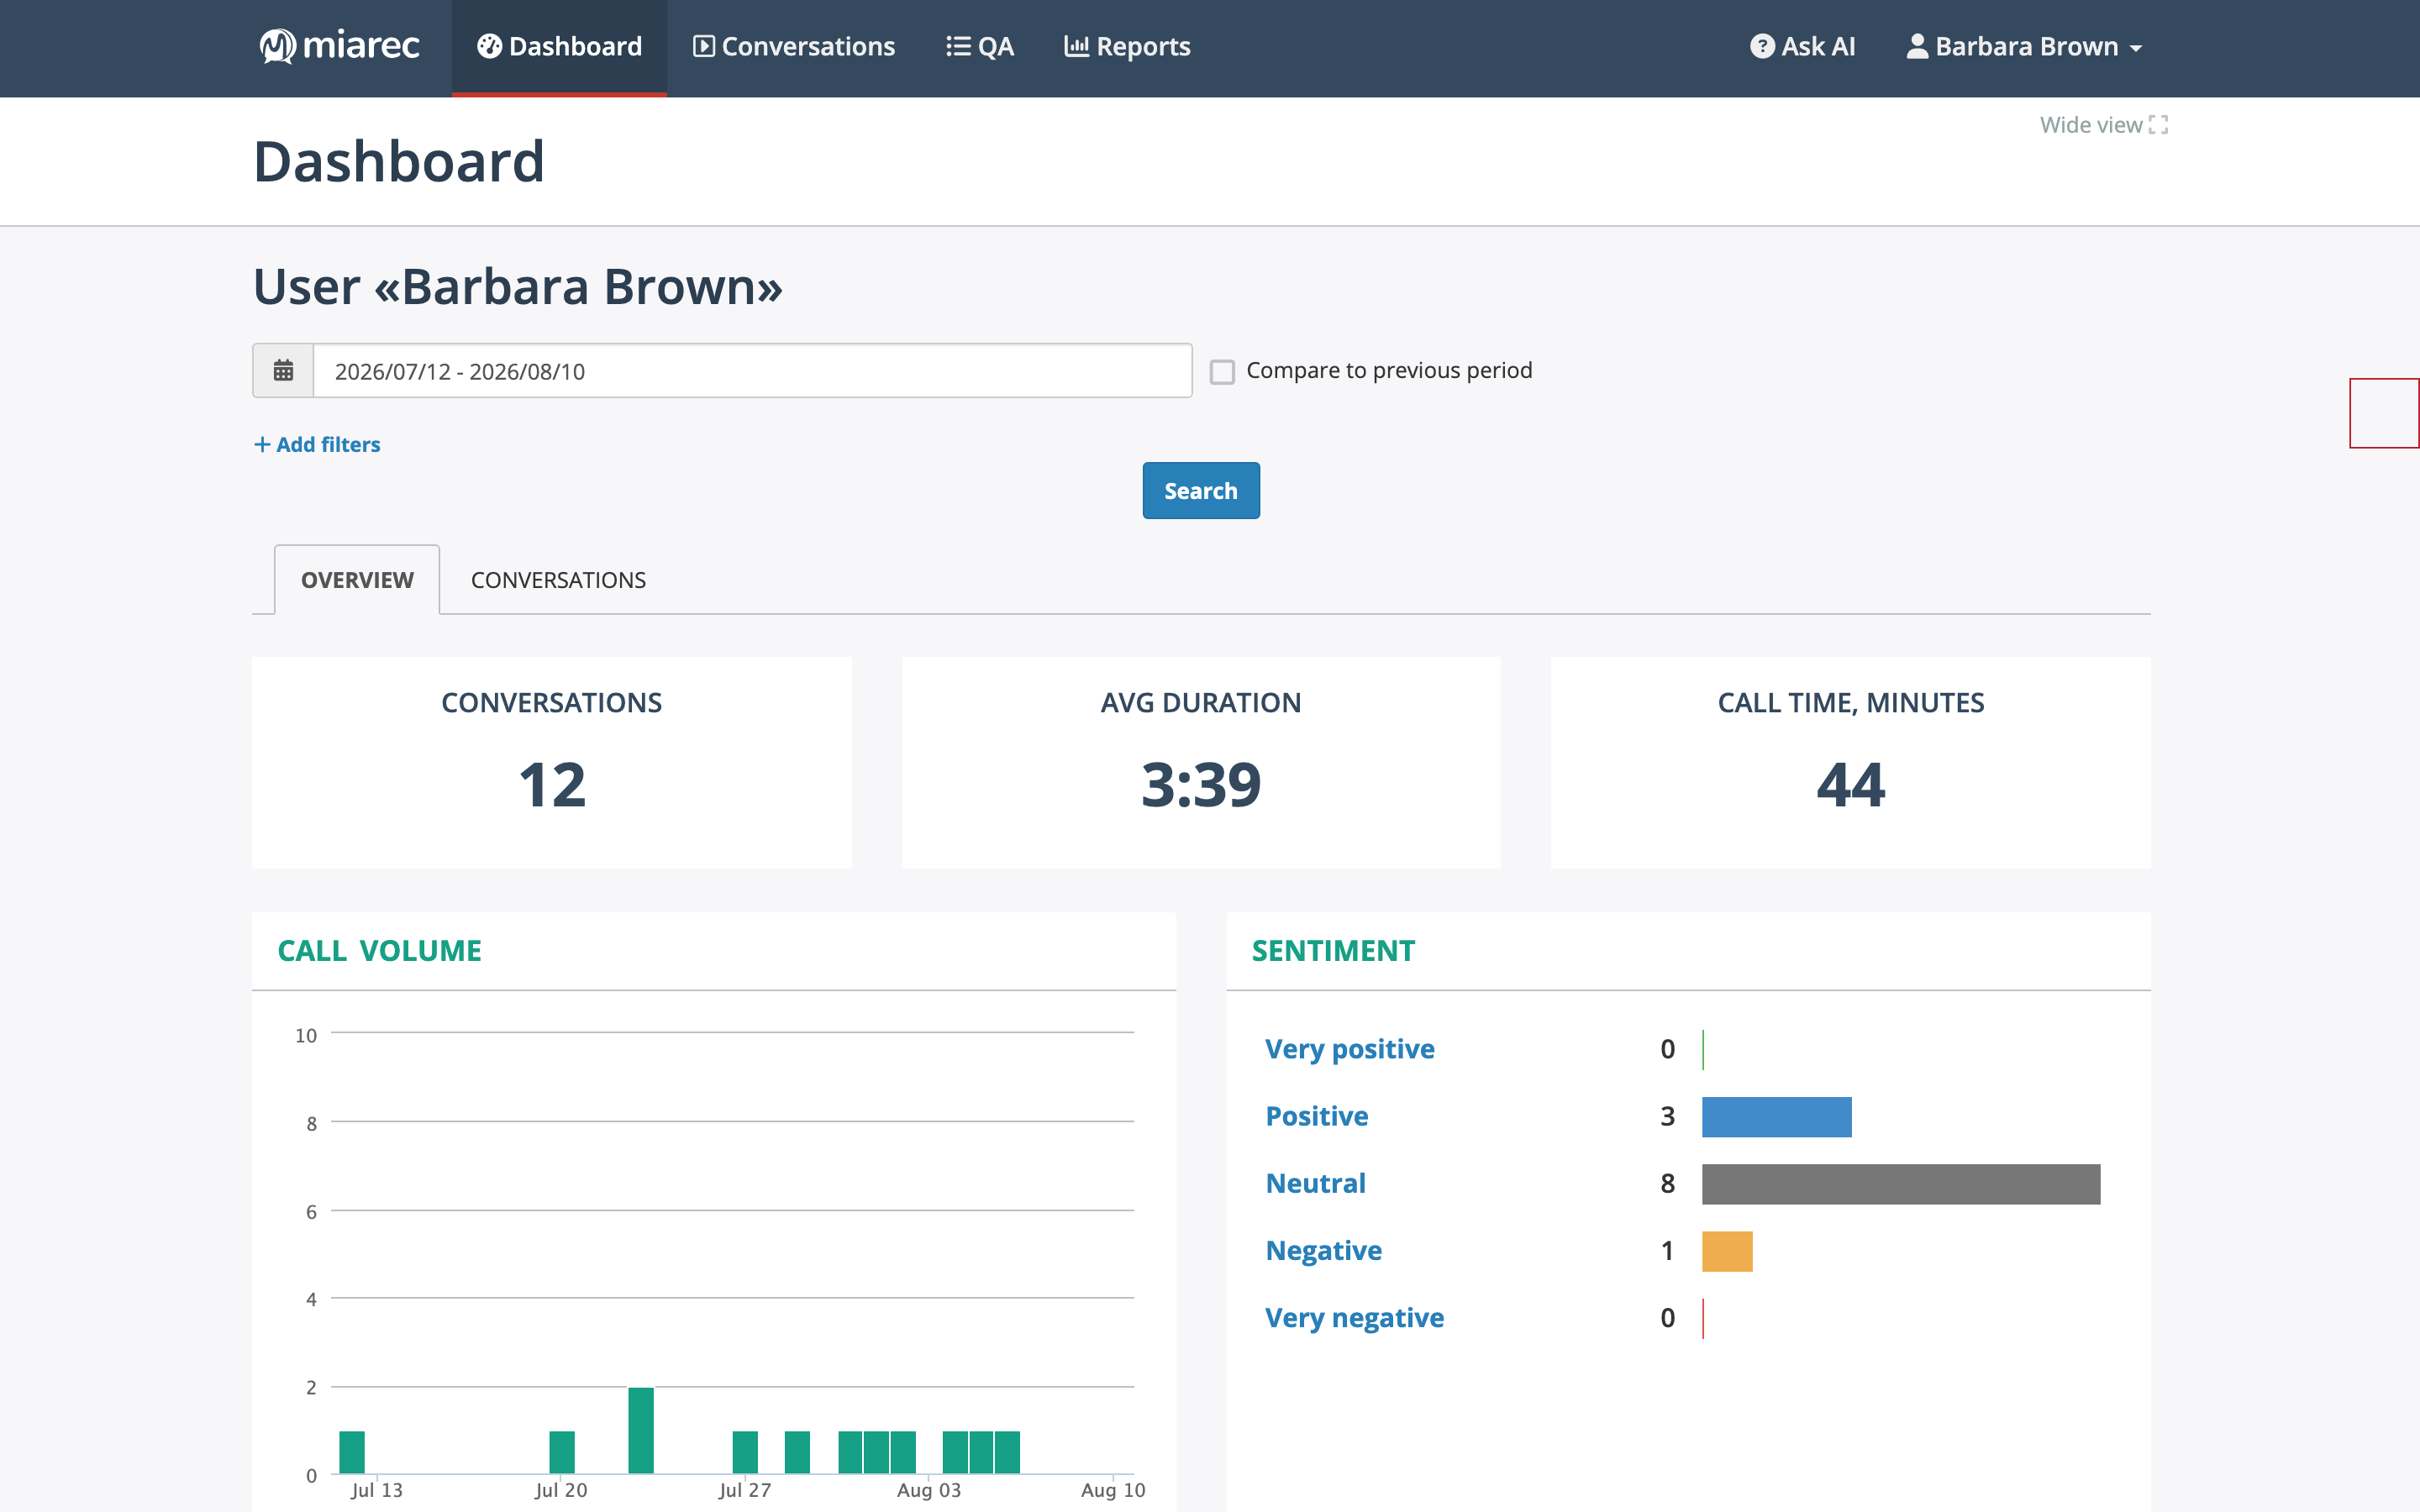
The same Dashboard page as an agent sees it: the dashboard is scoped to the agent's own conversations ("User «Barbara Brown»"), with fewer tabs, and the Administration menu is absent.
A few interface details
- Landing page — signing in opens the Dashboard, scoped to what you can see: the organization dashboard for supervisors, your personal dashboard for agents.
- Wide view — the Wide view link in the top-right corner stretches the page content to the full width of the browser window; useful on list pages with many columns. Click Normal view to switch back.
- Search — quick search lives on the Conversations page toolbar; the Advanced Search tab offers a full filter builder, including transcript-text search. See Quick search and Advanced search.
Next steps
- Dashboards — start with the analytics dashboards.
- Browsing conversations — find and play back conversations.