Reporting
Reports gained breakdown columns with drill-down to the calls behind any number, data bars, one row per evaluation report and expanding scorecard columns in Call Details reports, evaluation grouping and breakdowns in Calls Summary reports, and corrected totals.
Breakdown columns in Calls Summary reports
New feature for supervisors and report designers.
Any measure column in a Calls Summary report, such as Calls - Total Calls, can be split into sub-columns by another attribute: a custom field like call reason or resolution status, direction, topic, sentiment, or an evaluation score.
Select Breakdown By Attribute on a column, choose the attribute under Breakdown By, then pick Auto buckets to show the Top N or Bottom N values with an optional Other bucket, or Static buckets to list the values yourself. Bucket display order sorts auto buckets by Measure value or by Breakdown value, so a CSAT breakdown reads 1, 2, 3, 4, 5.
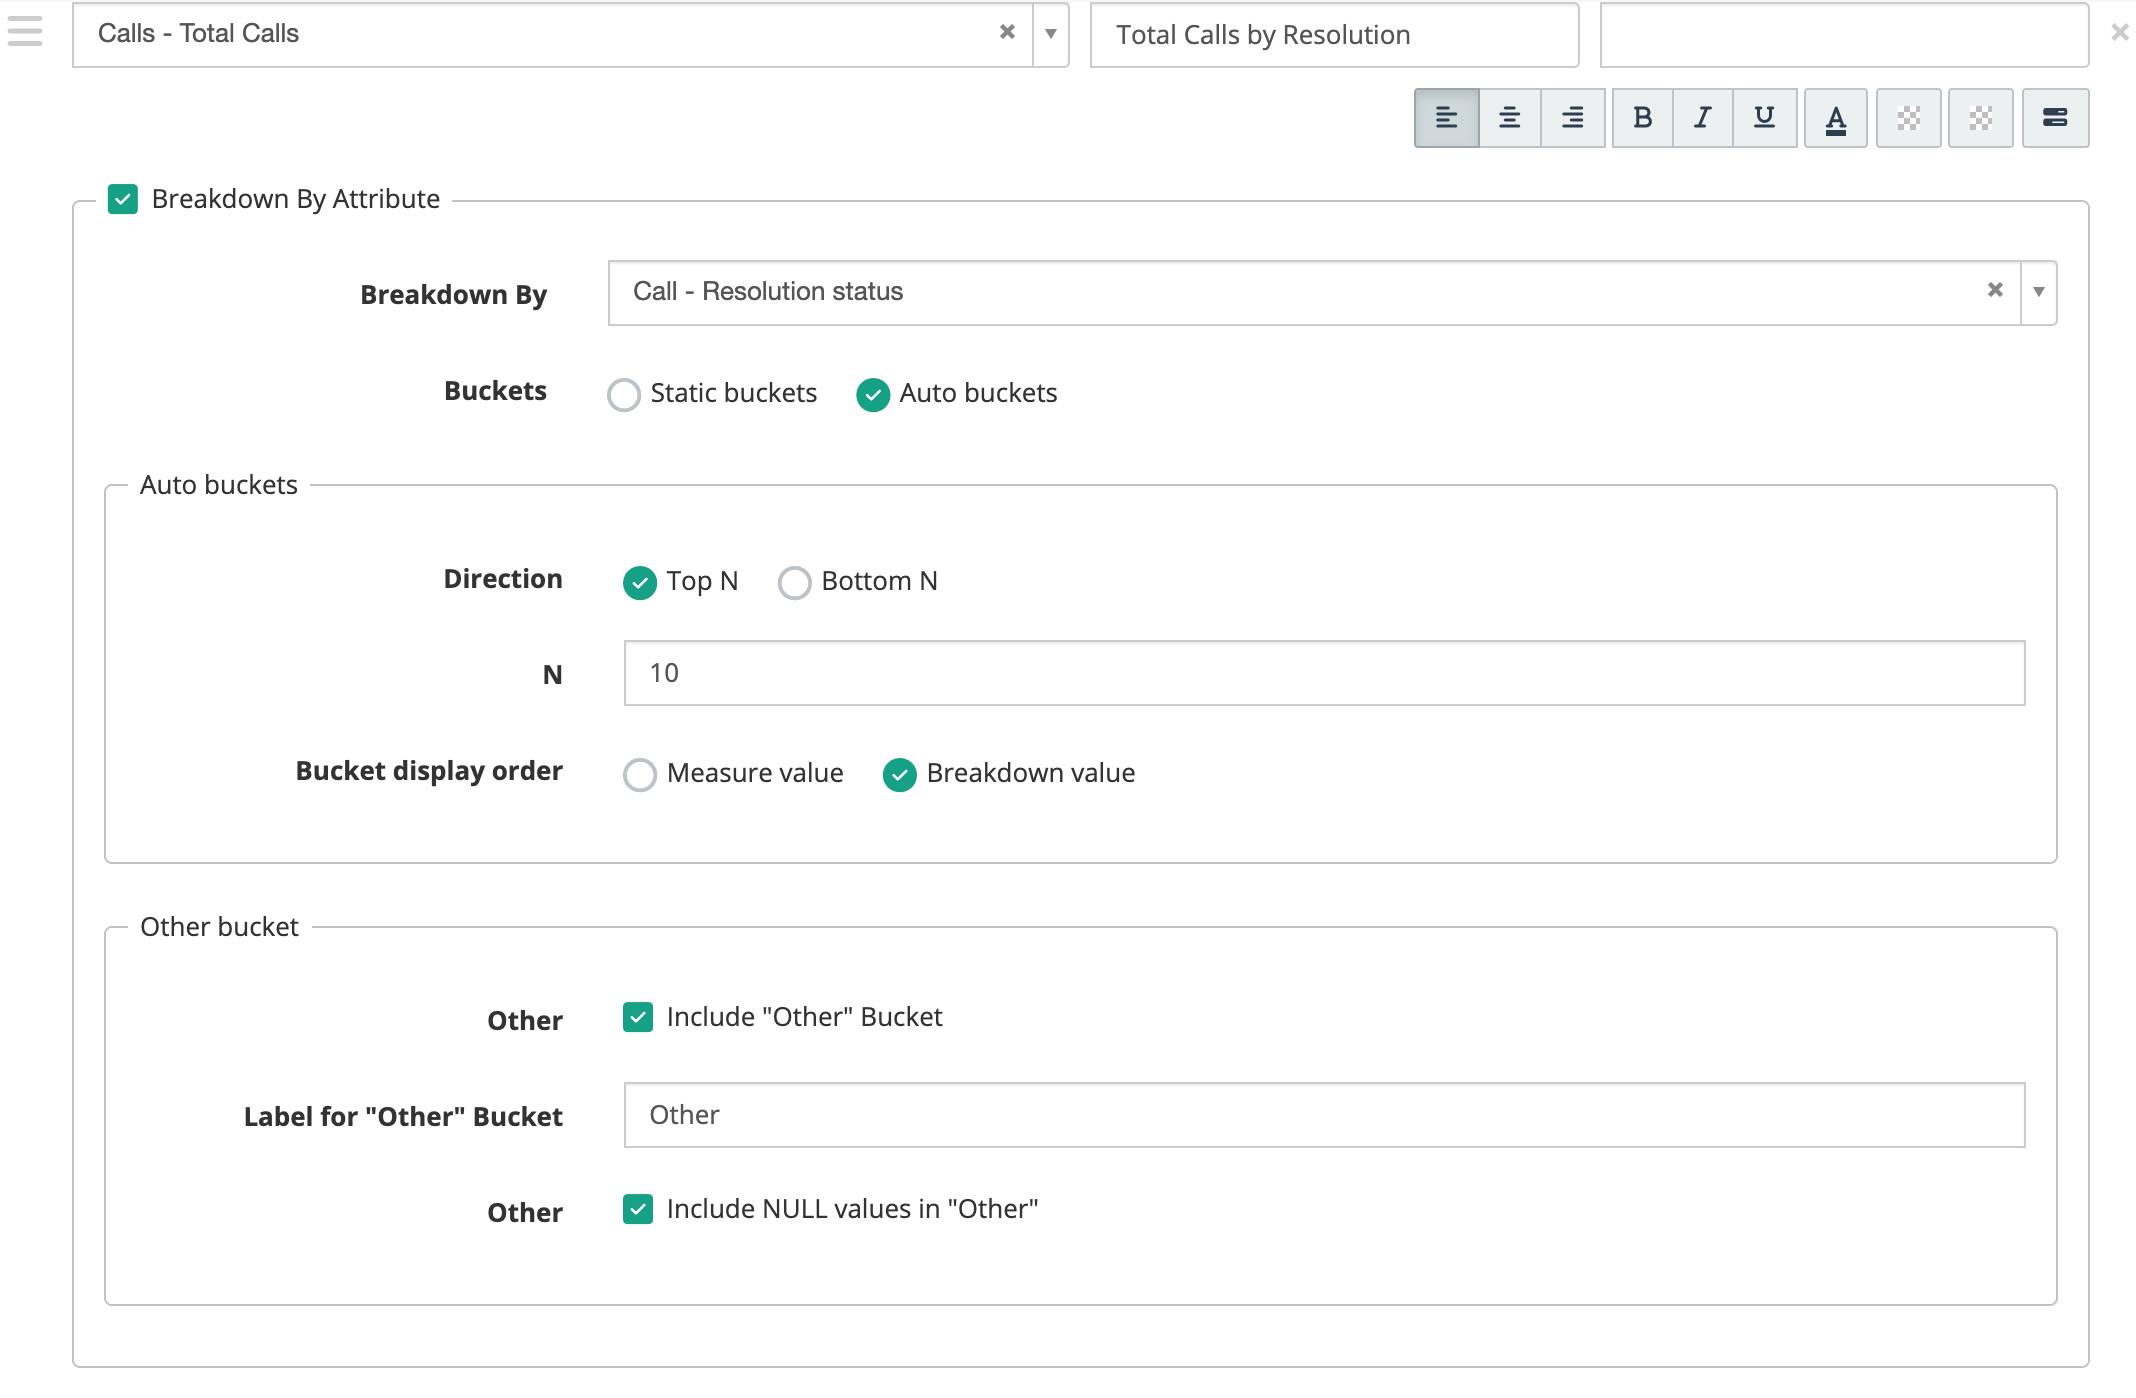
The Breakdown By Attribute settings of a Total Calls column, with auto buckets by resolution status.
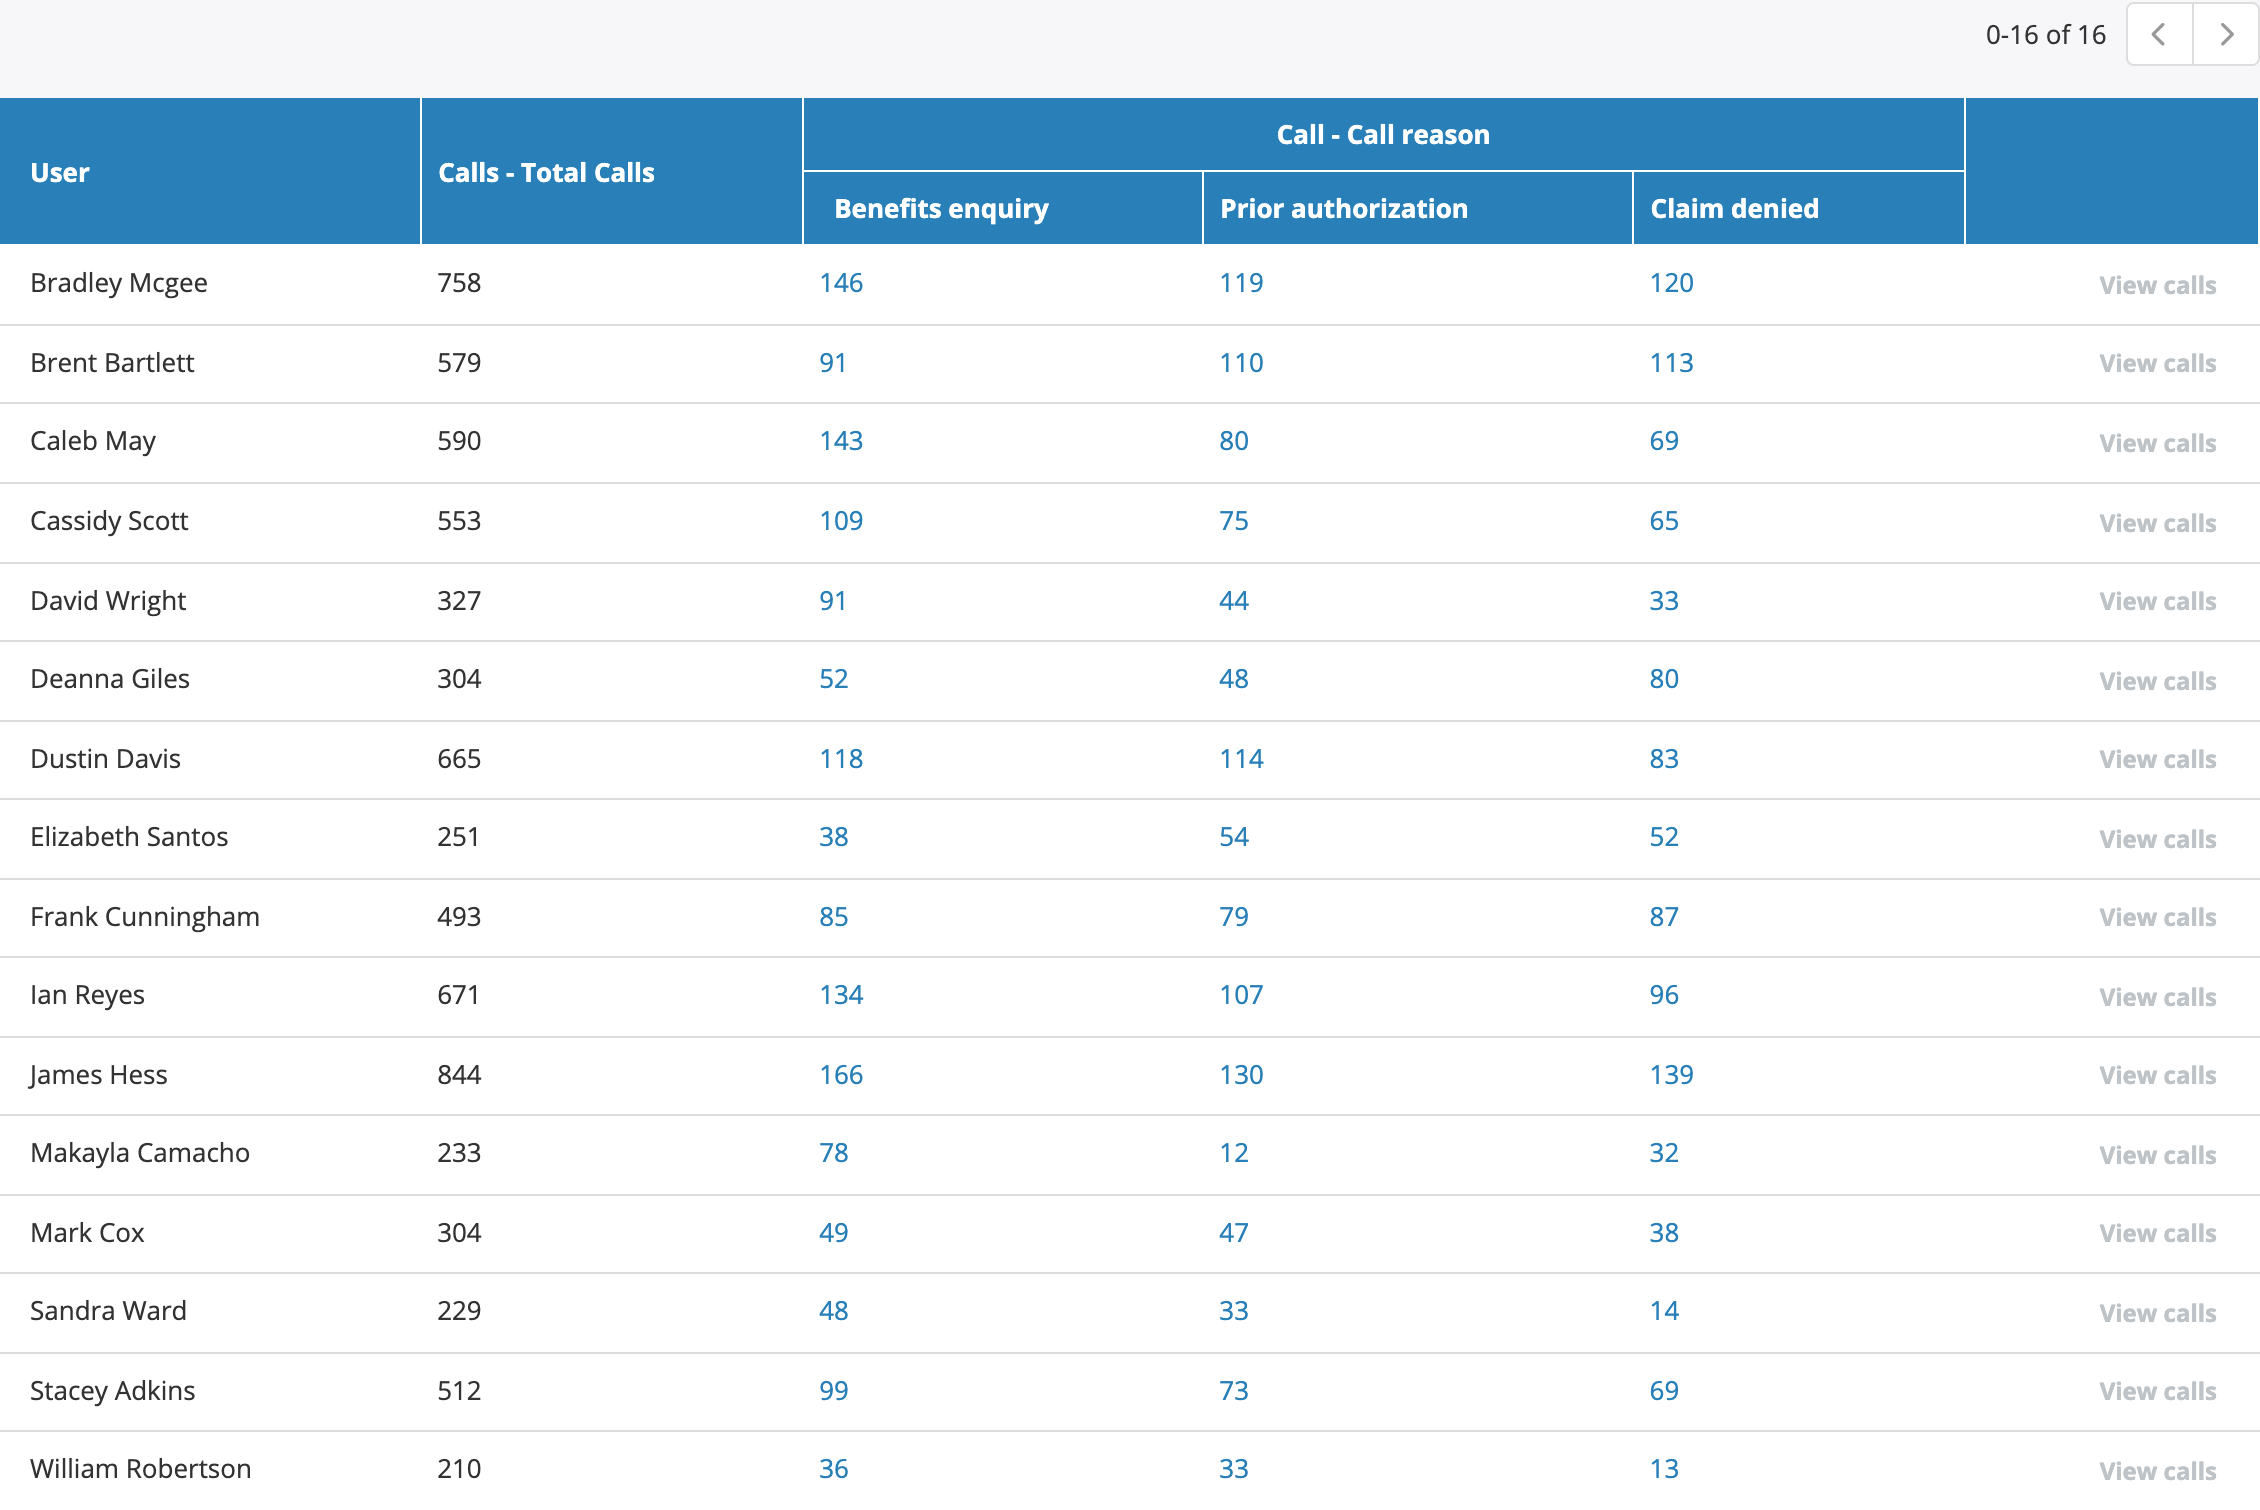
Total calls per user, broken down by call reason. Each sub-column cell links to the matching calls.
Every sub-column cell is a link. Clicking it opens the calls list with the row's grouping filter and the bucket filter already applied, including Other buckets and score or date ranges. The View calls link at the end of a row still opens the calls behind the whole row, and in Call Details reports a row that represents an evaluation opens that evaluation.
The Display As > Heatmap option is removed in favor of breakdown columns.
See Creating report templates.
Data bars in report cells
New feature for report designers.
A Data Bar toggle on a column row draws a bar behind each value, scaled to the column's range, so large tables can be read at a glance. Set a gradient color on the column first; the bar takes that color and does not render without one. A conditional formatting rule can also turn the bar on.
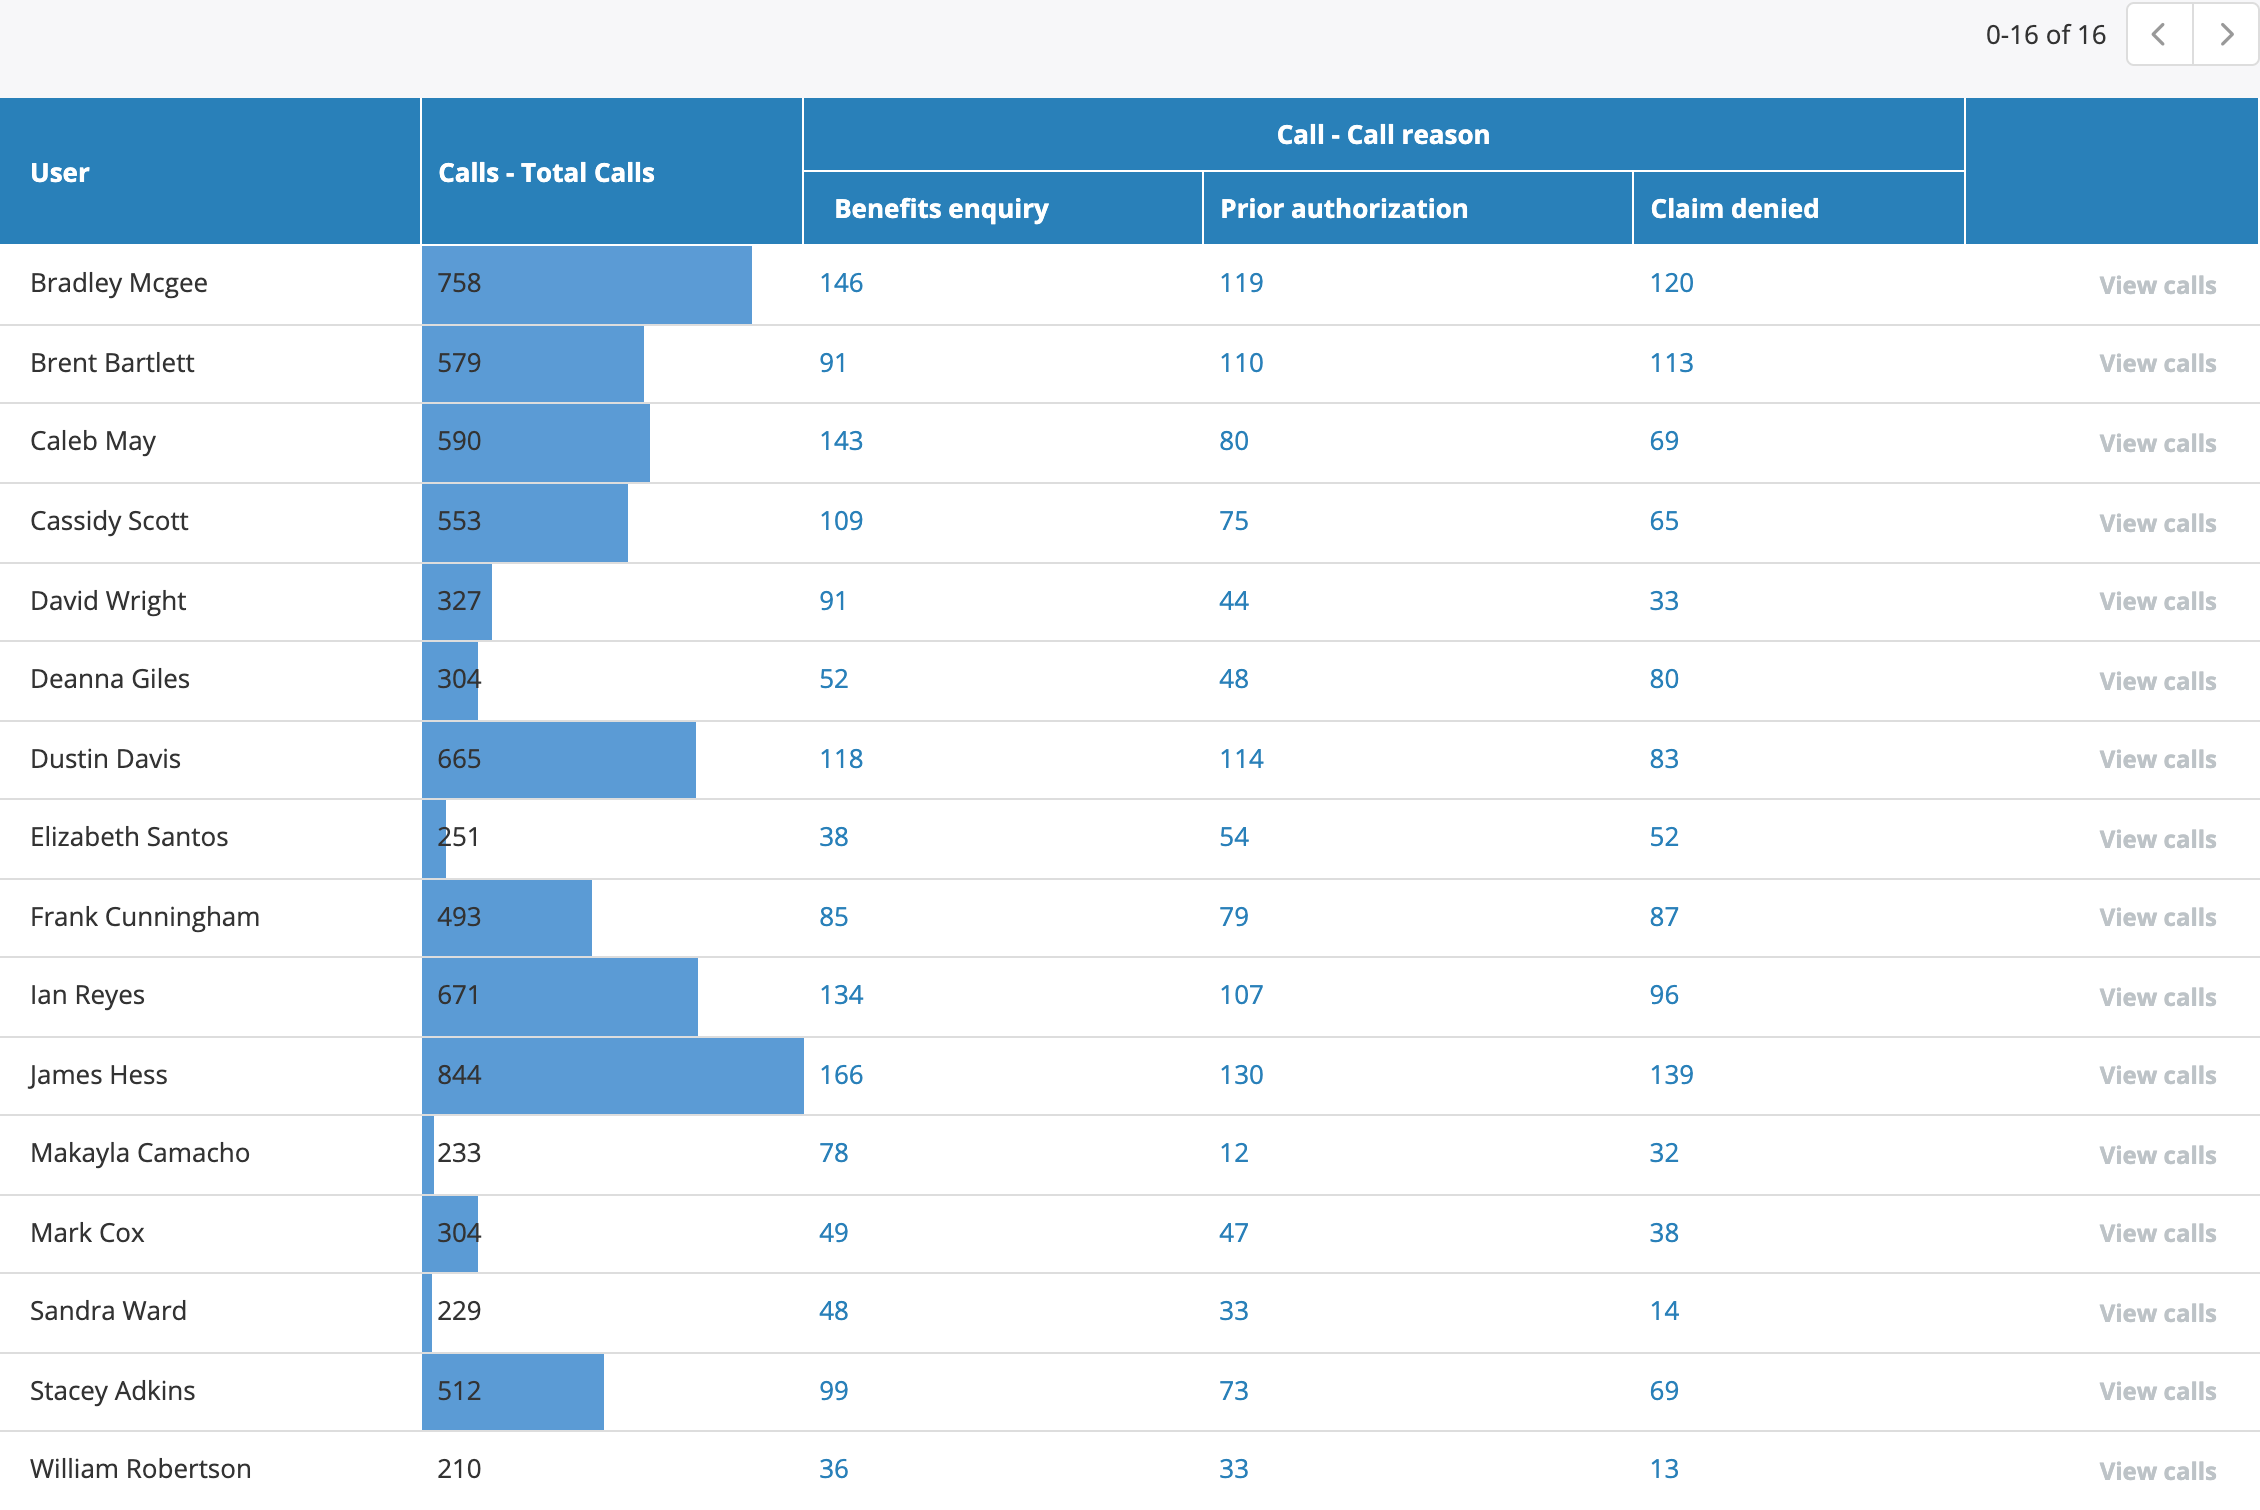
Total calls per user with data bars.
Evaluation reports in Call Details reports
New feature for QA teams and report designers.
One row per evaluation report
A Call Details report used to show one row per call, with evaluation data aggregated into that row. Now, when the report includes any Evaluation Report column, it shows one row per evaluation report. A call with two evaluations produces two rows, each with its own evaluator, status, score, and pass result, and the View link on the row opens that evaluation.
The new columns cover the report name, status, score, points, pass threshold, pass result, evaluator, agent, assigner, timestamps, and the three feedback fields. Section and question columns add the same detail one level down, including override and original values.
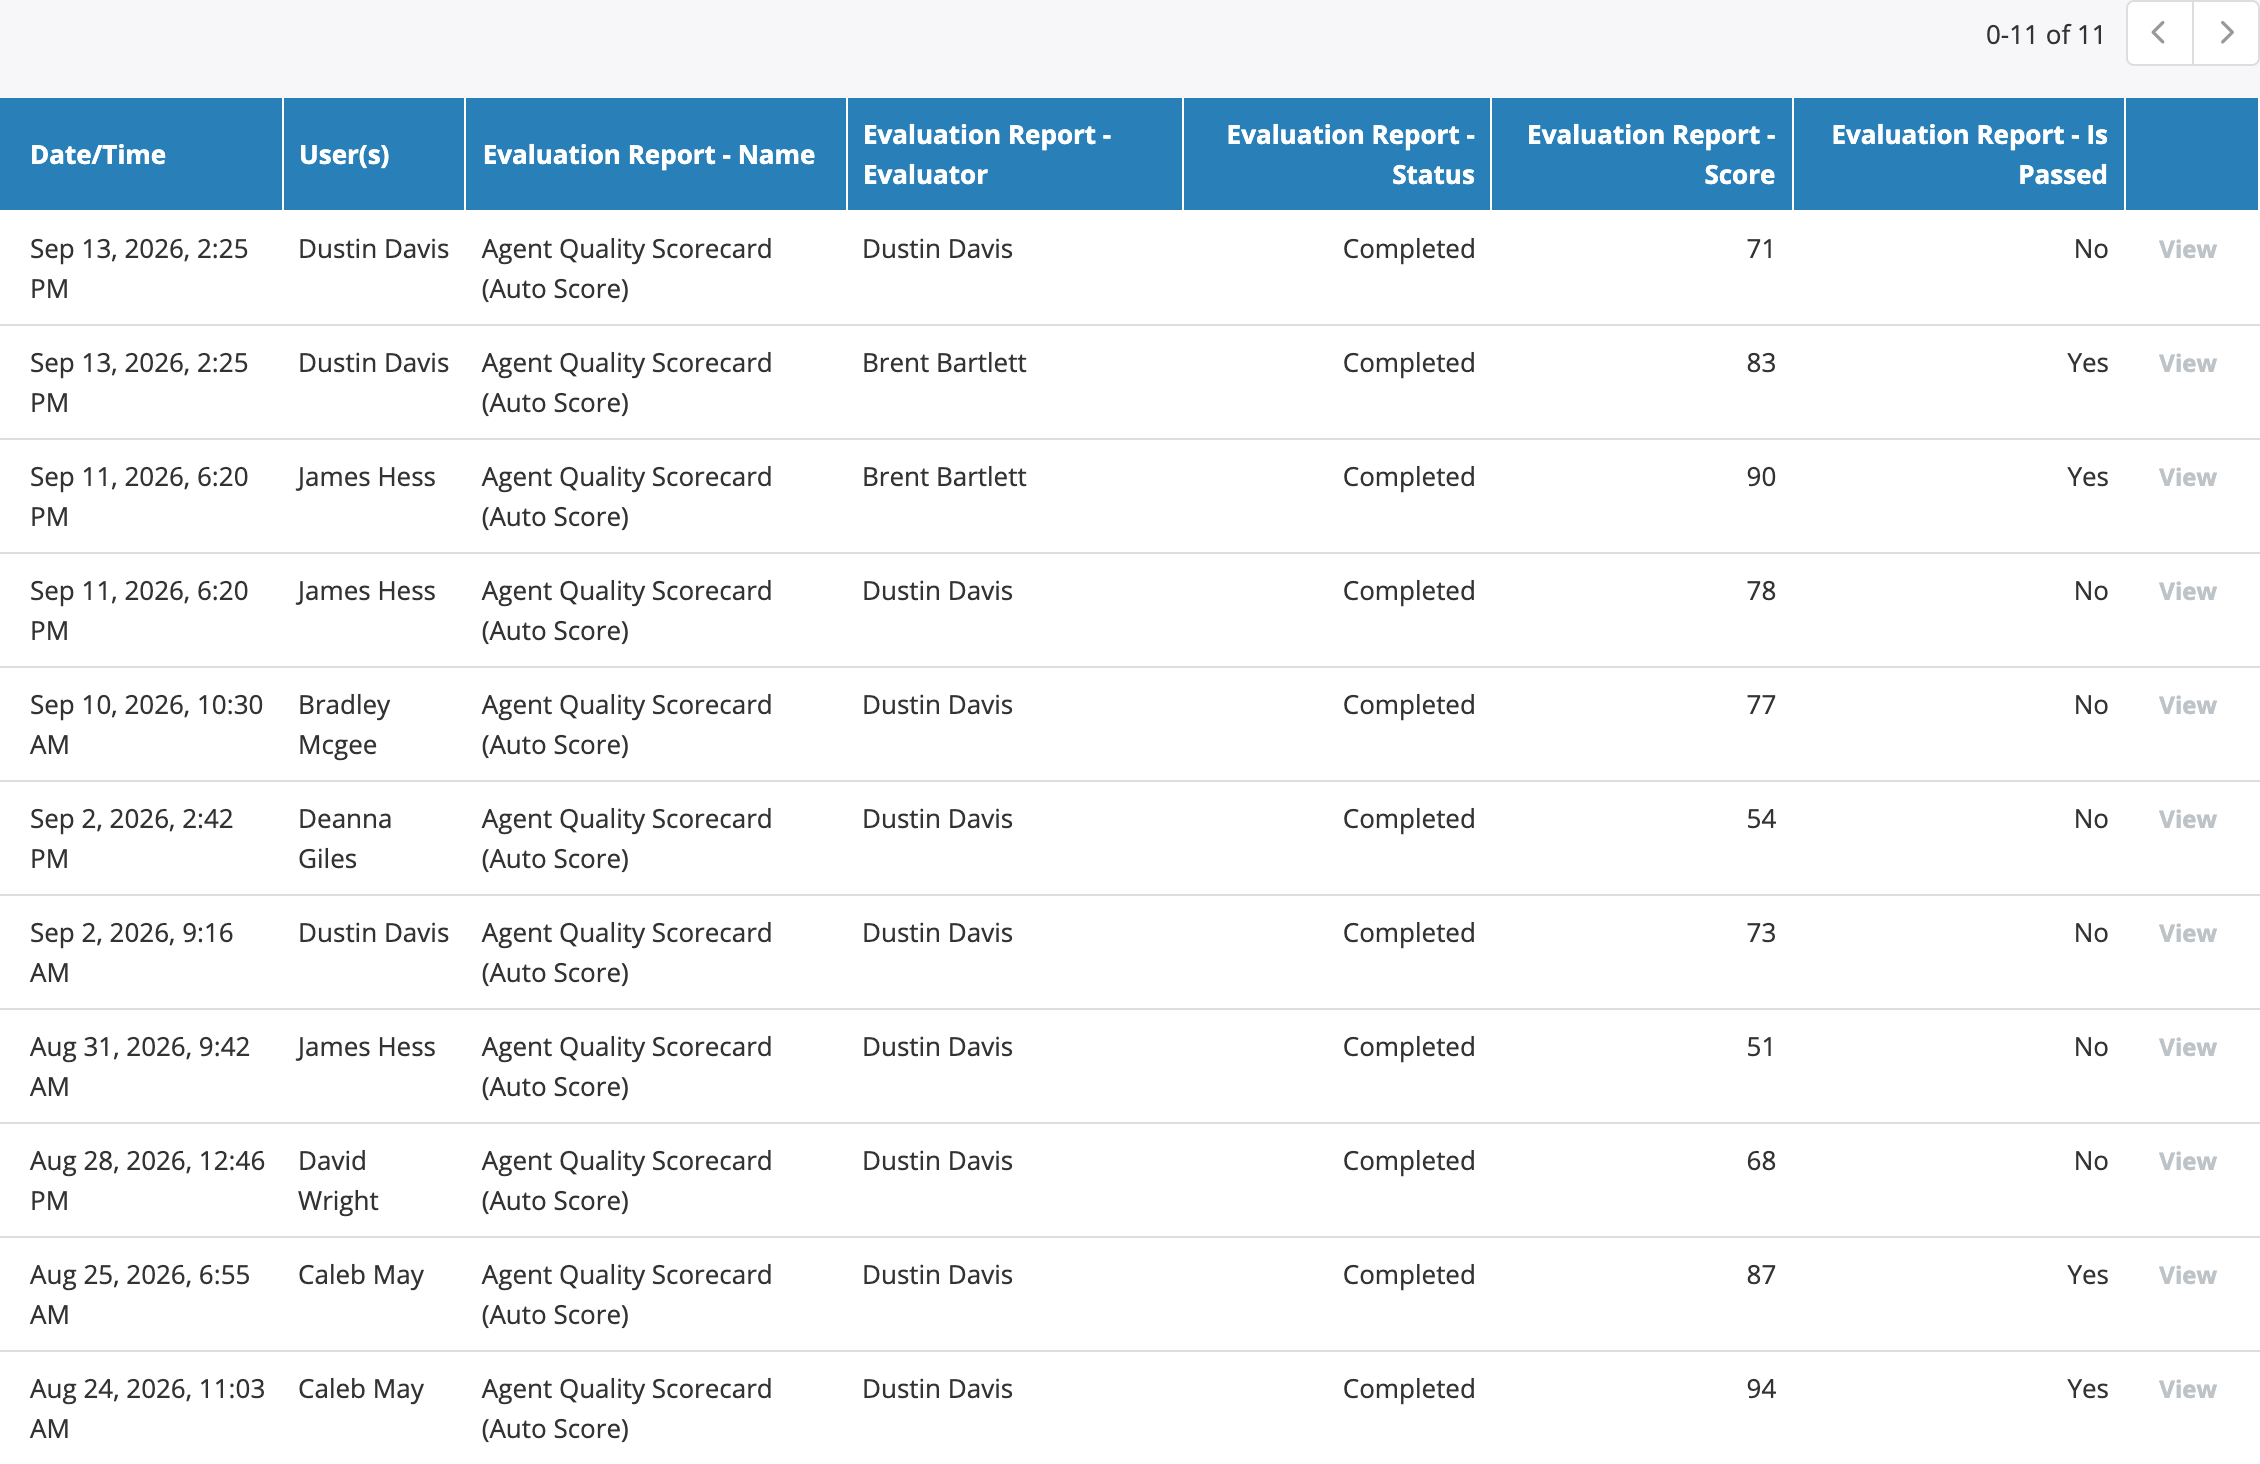
One row per evaluation report, with the evaluator, status, score, and pass result of each.
Expanding columns: one column per section or question
Five new columns expand at run time into one column per scorecard section or question found in the report scope, the same way a breakdown column splits a measure in a Calls Summary report:
- Evaluation Section Score by Title, Evaluation Section Status by Title, and Evaluation Section Feedback by Title
- Evaluation Question Score by Title and Evaluation Question Status by Title
Add one column to the template and the run produces the whole scorecard matrix: a two-row header with the column name or the section title on top and the section or question title under it. When more than one form is in scope, the form title becomes the top header, so a mixed report stays readable.
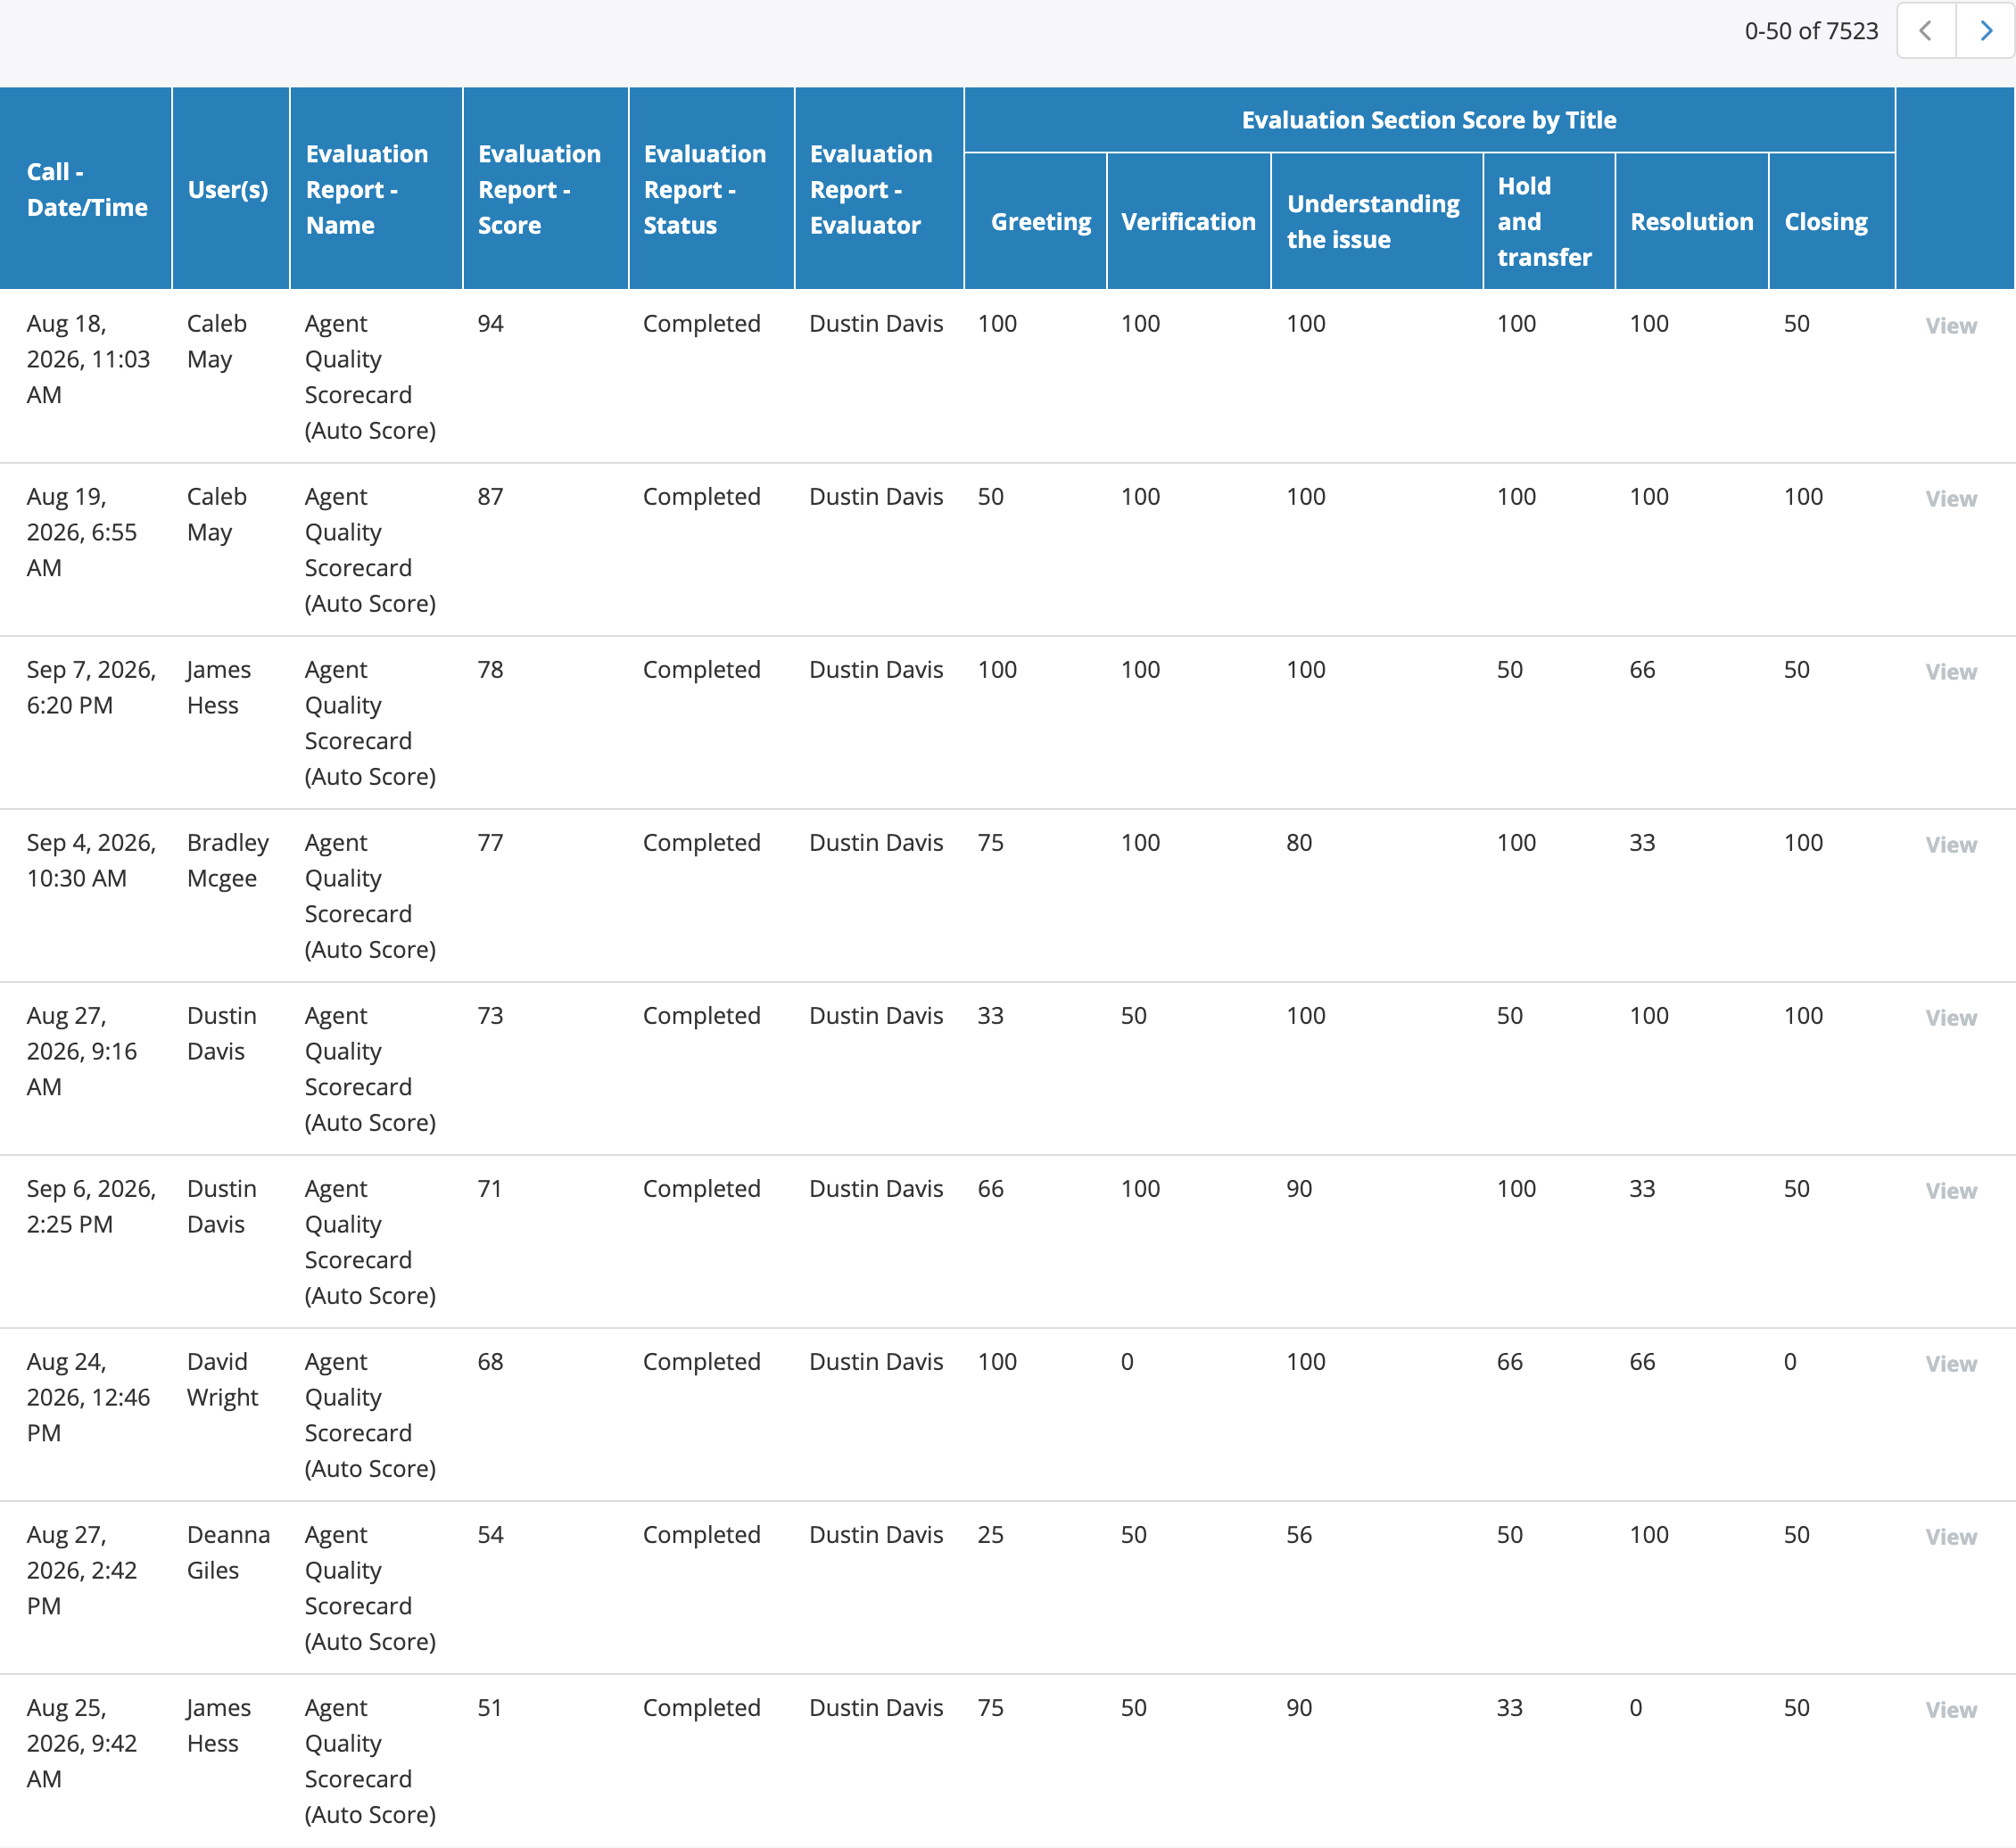
Evaluation Section Score by Title: one score column per scorecard section.
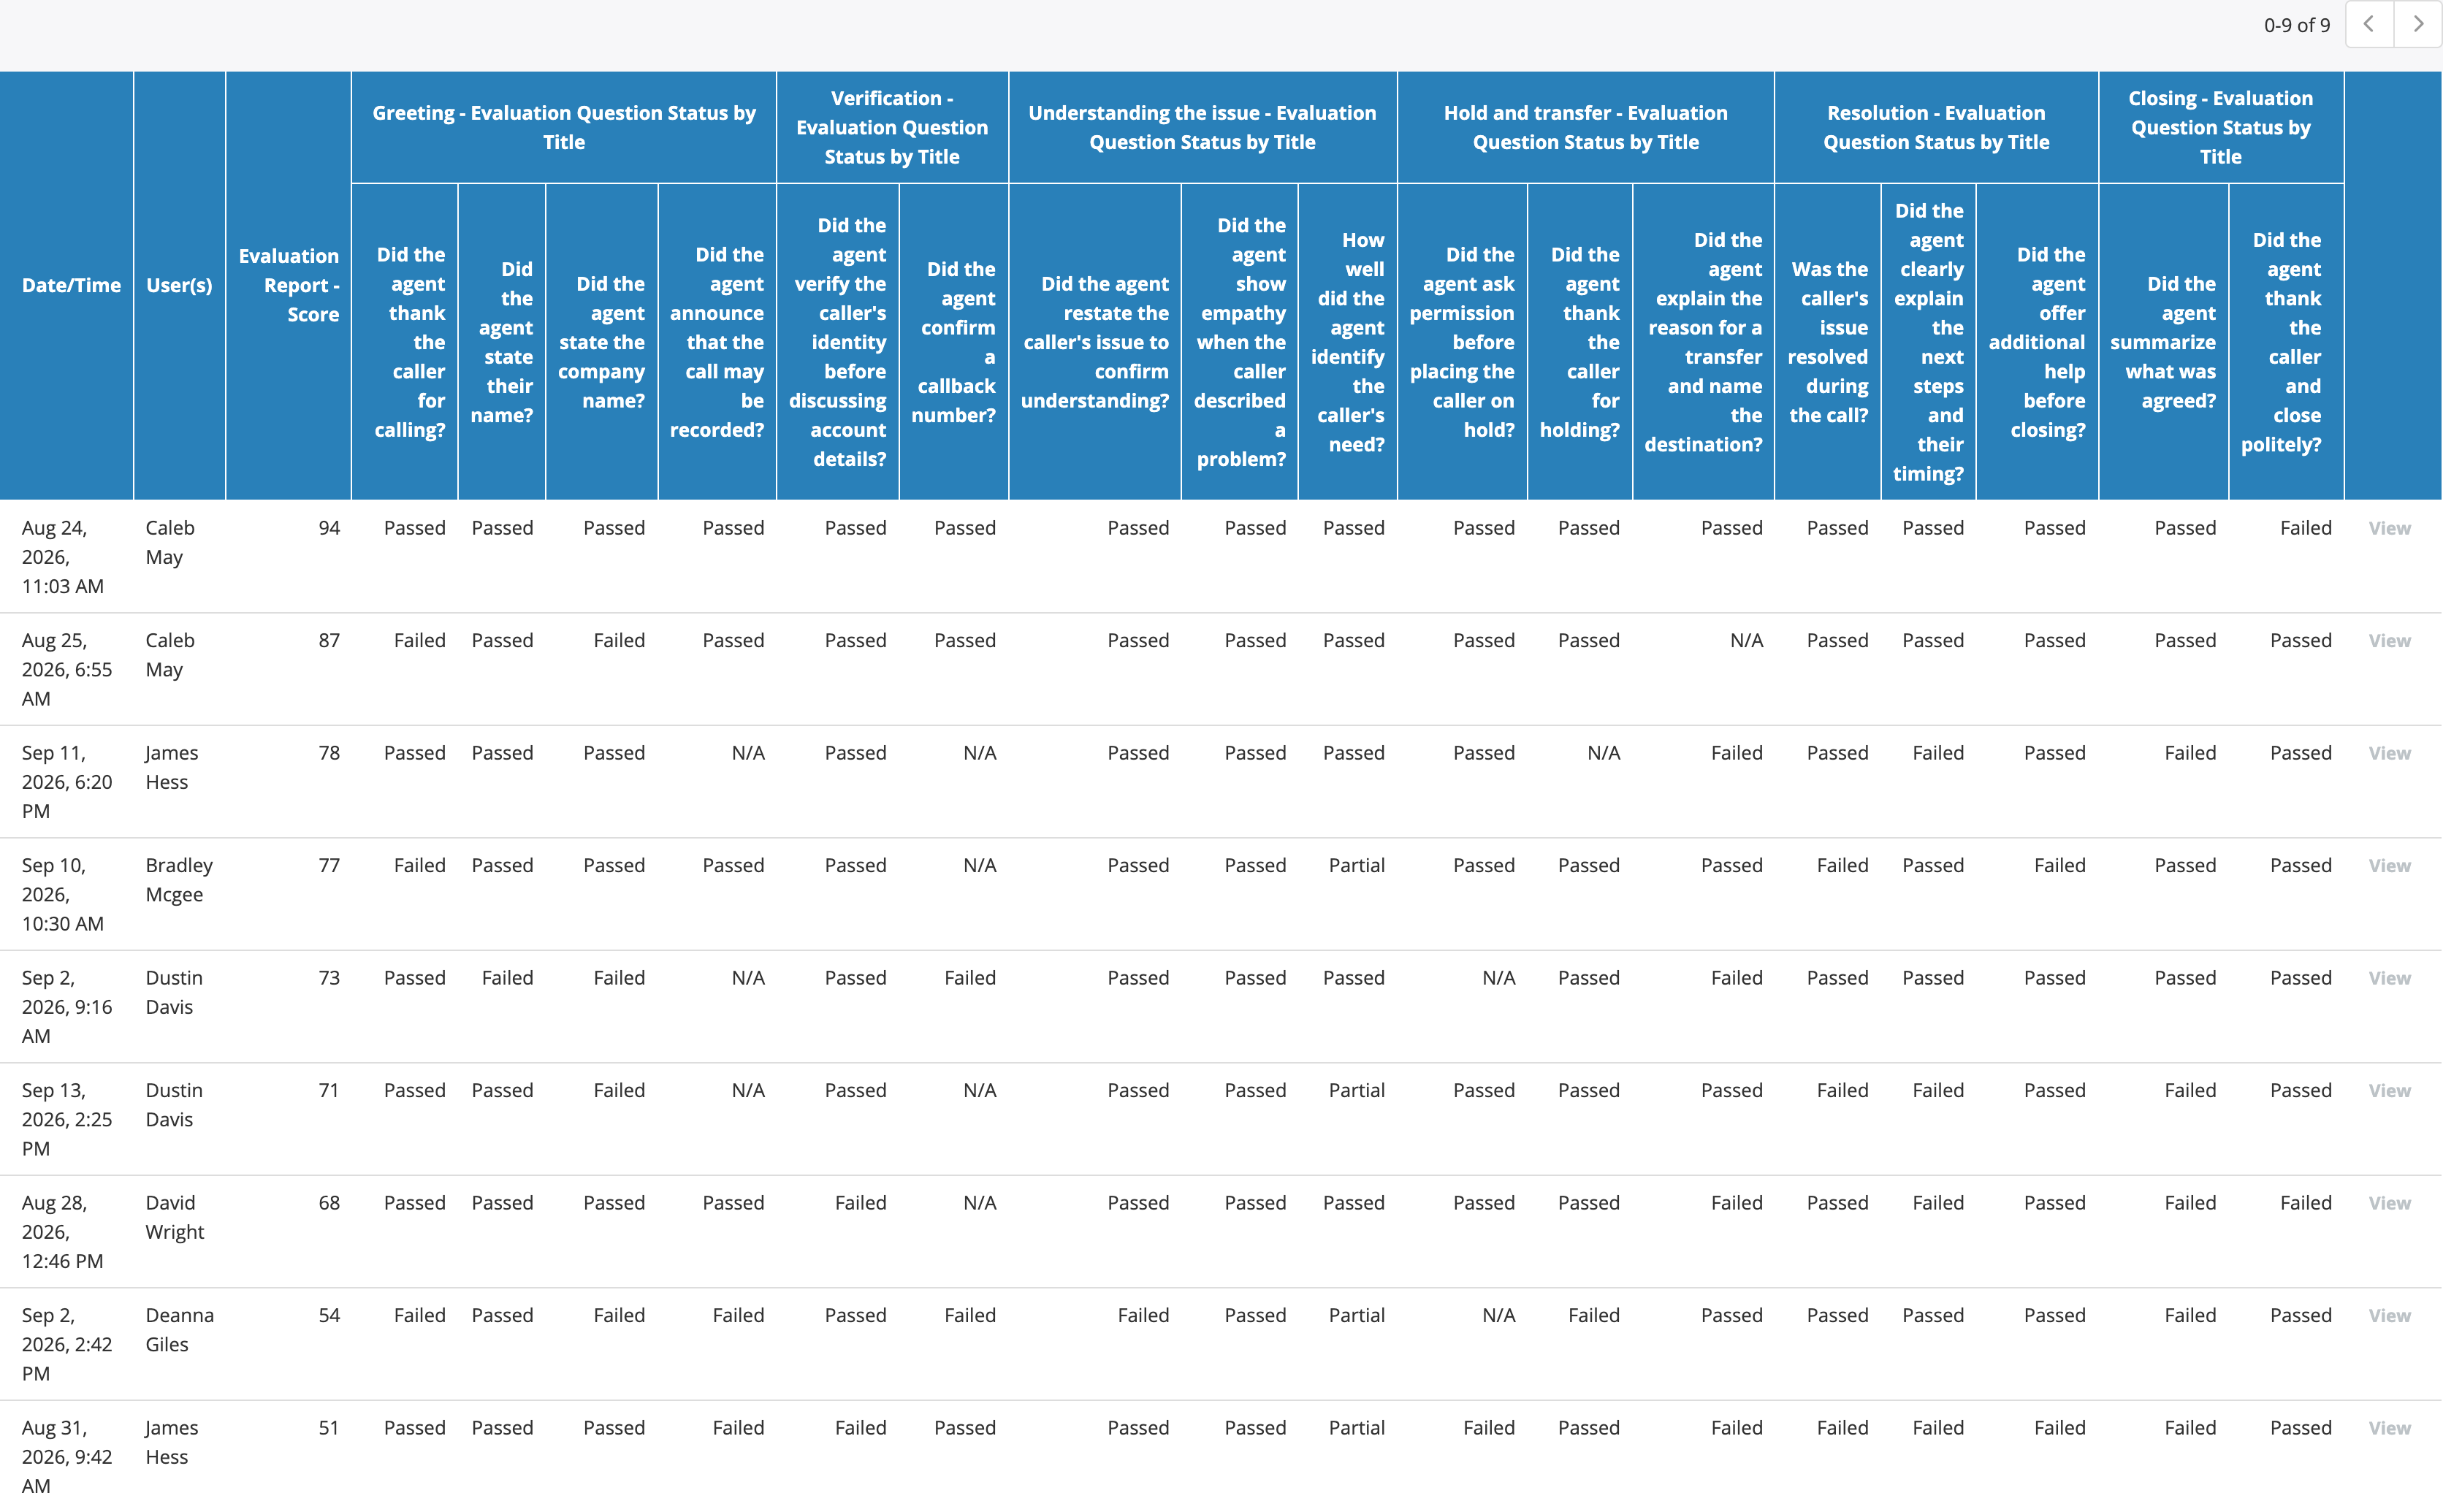
Evaluation Question Status by Title: one status column per question, grouped under the section title.
Excel and PDF exports reproduce the expanded columns with the same two-row header: the section title spans its question columns in Excel as merged cells, and in PDF as a nested header. You can send the matrix to a spreadsheet without rebuilding the columns by hand.
See Call Details report and the column reference.
Evaluation grouping and breakdowns in Calls Summary reports
New feature for QA teams and supervisors.
Calls Summary reports can group rows by Evaluation Form Section / Question or by Evaluation Report - Status. Grouped by section and question, one report shows how every question on the scorecard performs across all evaluated calls, so a QA lead can see at a glance which behaviors agents fail most often.
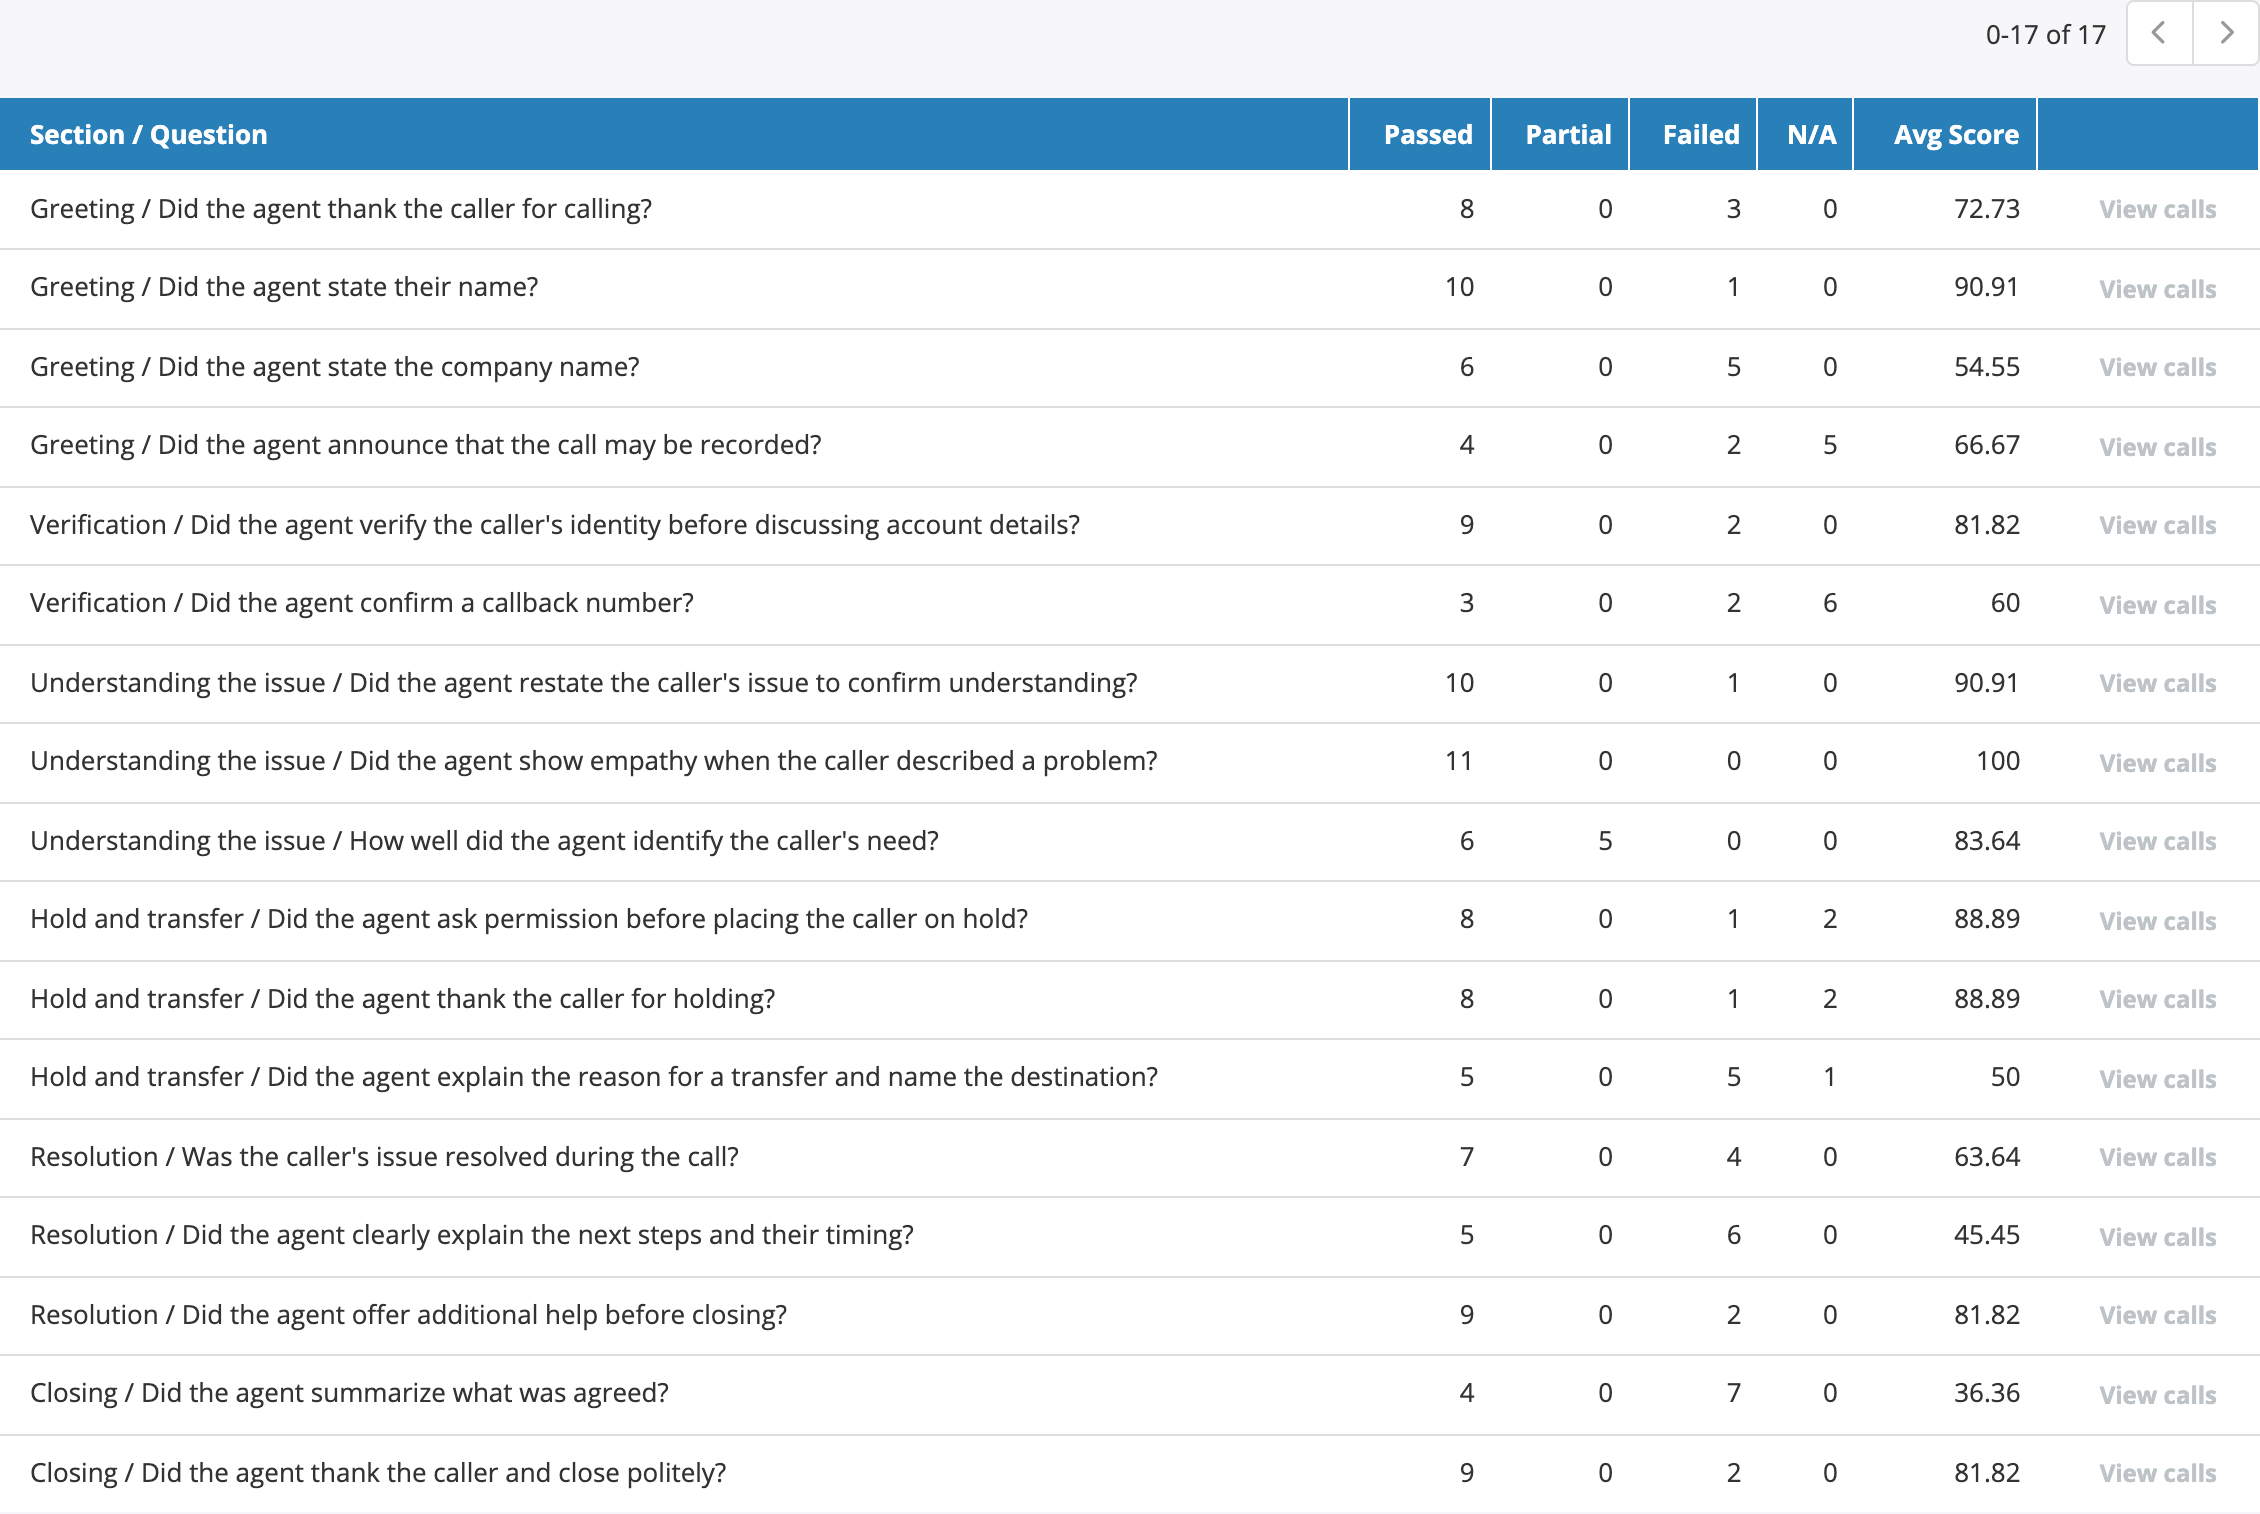
Calls grouped by scorecard section and question, with passed, partial, failed, and N/A counts and the average score for each.
The evaluation attributes are also available under Breakdown By Attribute: evaluation report score and status, section score and status, and question score, points, status, and original values. Split a call count by evaluation score, for example, to see how many of each agent's evaluated calls fall into each score band; each cell links to the calls behind it.
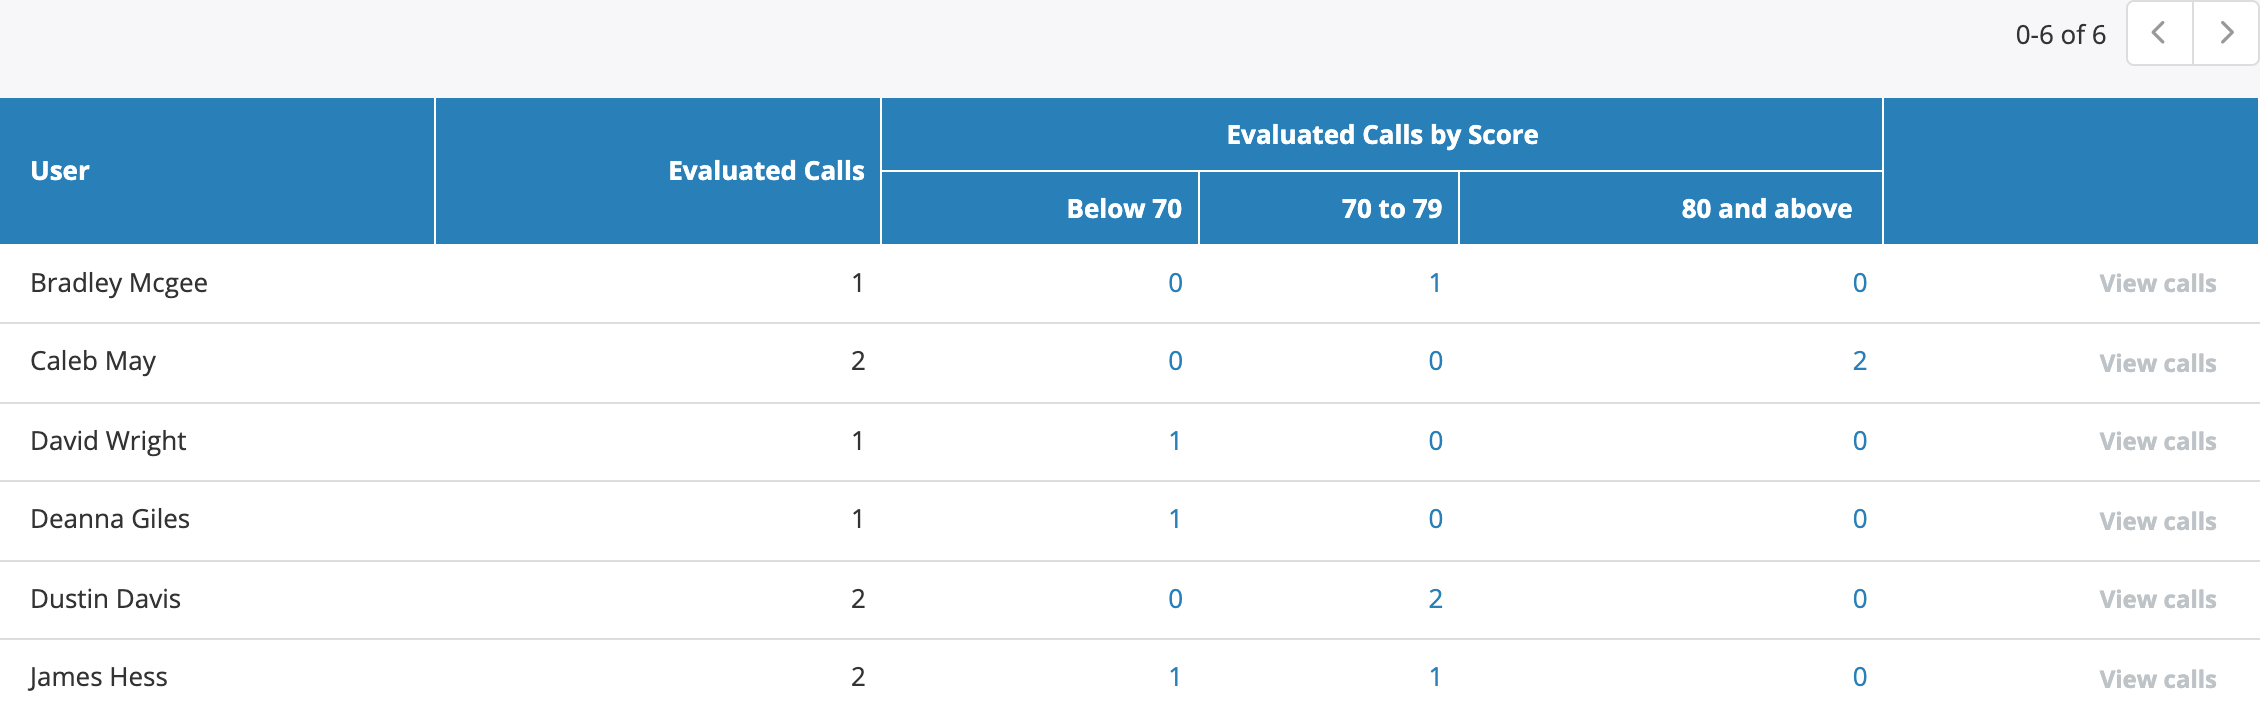
Evaluated calls per user, broken down into three static score buckets.
Improvements
- Evaluation question filters in reports, dashboards, and search use the effective value after an evaluator override, so counts agree with report totals.
- The run page of an interval report shows under More details which periods came from cache and which were loaded fresh.
- Report periods show the inclusive end date in the web UI, PDF, and Excel.
- New reports default to no chart, and new columns default to left alignment.
Fixes
- Calls Summary totals are correct when call measures are combined with evaluation report, section, question, or file columns, filters, or groupings.
- Summary rows of grouped reports show averages over all matching calls.
- Calls Summary reports with sentiment average columns no longer fail to run.
- Evaluation fail-count columns count correctly.
- Reports that group by a custom field or evaluation question column no longer fail with a database error.
- Date-only and time-only columns in Call, Audit Trail, and System Log reports show the date or time instead of a full timestamp.
- Excel exports show labels for status and Yes/No columns instead of codes, and negative numbers round correctly.
- Drill-down from a Call Details row opens the call even when Call ID is not a selected column, and row drill-down no longer adds filters from non-grouping columns.