CX metric dashboards
Beyond the built-in analytics tabs, the dashboard grows one extra tab for every AI-scored metric your organization has enabled for dashboards — customer-experience metrics such as CSAT or NES, or any other numeric insight your organization measures. If your dashboard shows tabs like these, this page explains how to read them.
Where metric tabs come from
A CX metric in MiaRec is a configured insight: an AI task reads each conversation and writes a score into a custom field, together with the AI's reasoning (see CX metrics in the Overview guide). When your administrator enables such a field for dashboards, it appears as its own dashboard tab, named after the field.
The set of metric tabs is therefore specific to your organization — one organization may track CSAT and NES, another first-call resolution or a fully custom score.
Reading a metric tab
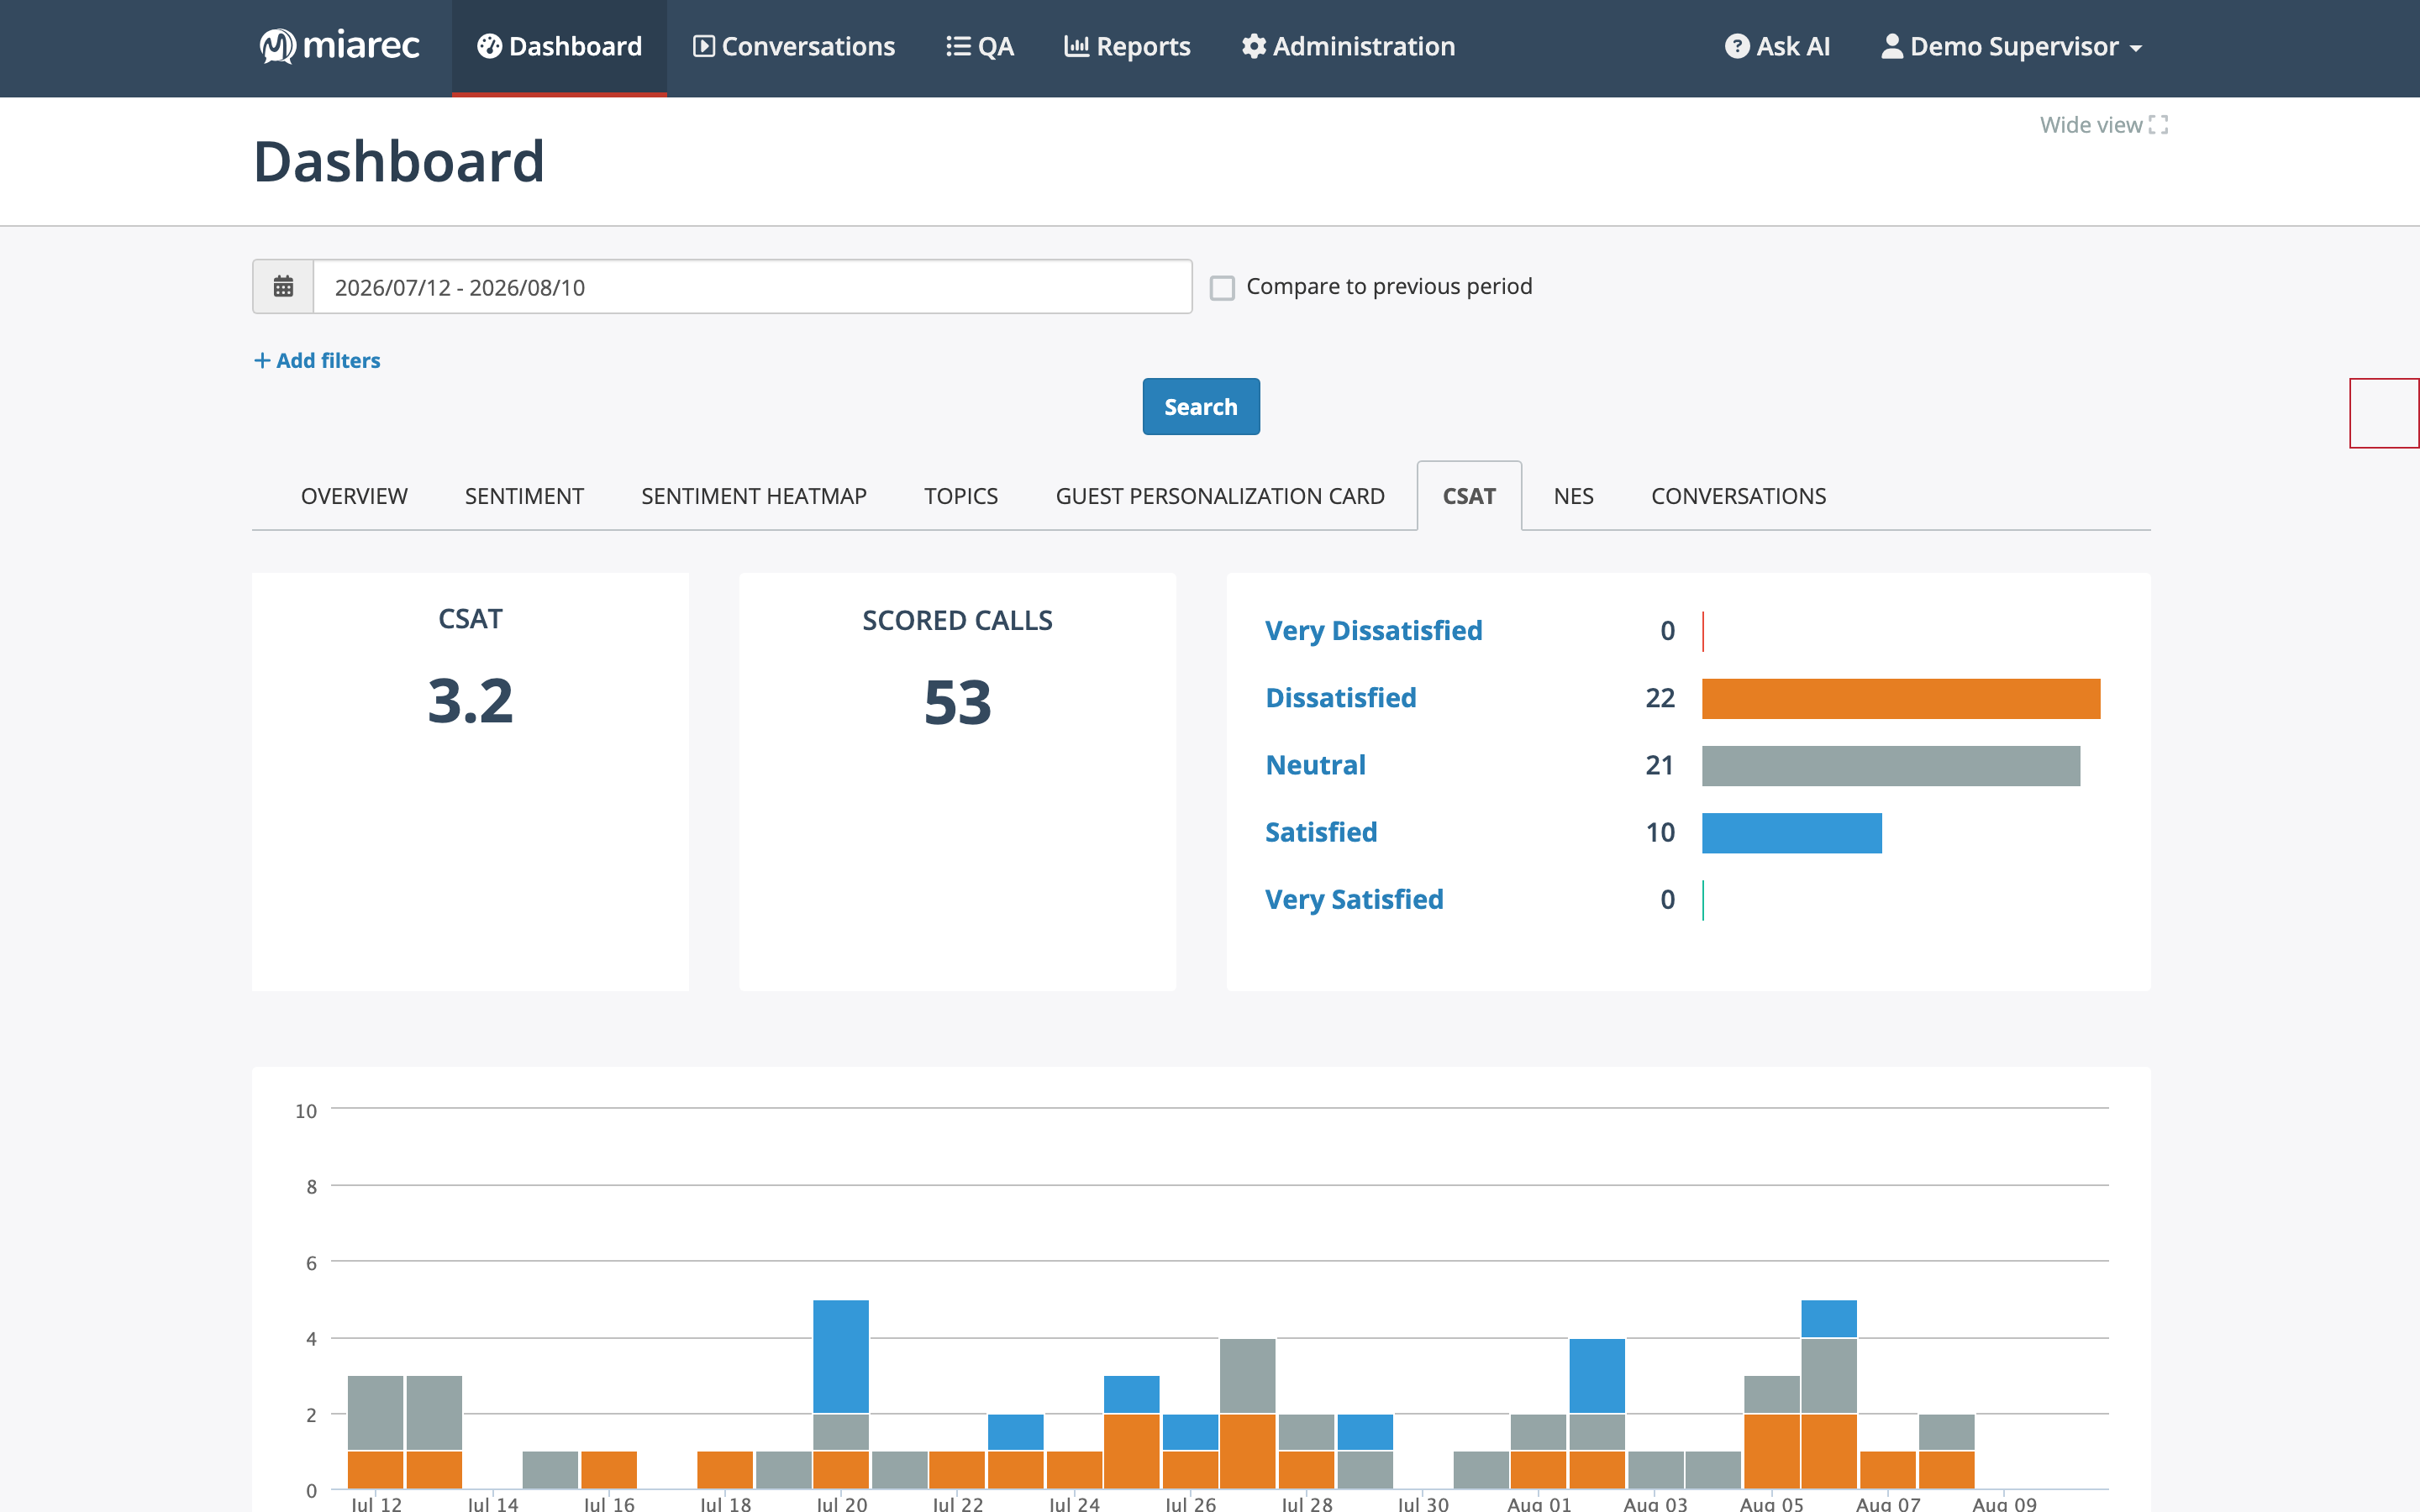
A CSAT metric tab. Notice the three panels: the aggregate score, the number of scored conversations, and the distribution of conversations across the metric's answer labels.
A metric tab shows, for the selected period:
- Aggregate value — the metric across all scored conversations (in the example above, an average CSAT of 3.2).
- Scored calls — how many conversations received a value for this metric. Conversations the AI could not score are excluded from the aggregate.
- Distribution — how conversations spread across the metric's labels (for example Very Dissatisfied through Very Satisfied), so you can see whether the average hides a polarized picture.
- Trend chart — daily conversation counts stacked by label, for spotting when the metric shifted.
To understand why an individual conversation scored the way it did, open the conversation's Analytics tab — each AI-scored value is stored with the AI's explanation. See AI insights.
Info
Metric tabs are available if your subscription includes Conversation Analytics and your administrator has configured the metric and enabled it for dashboards. How a metric is defined — the prompt, the value scale, and its labels — is also part of that configuration. See Creating custom insights and Custom fields in the Administration Guide.
Related pages
- Filtering dashboard data — restrict a metric to a period, direction, or duration.
- Drilling down — narrow a metric to a group or user.