Sentiment dashboards
The Sentiment and Sentiment Heatmap tabs show how customers felt across your conversations: the overall distribution, the daily trend, and where negative conversations cluster. Sentiment scoring itself is explained in Conversation Analytics — each conversation receives a score from -100 to +100, mapped to five labels.
Sentiment tab
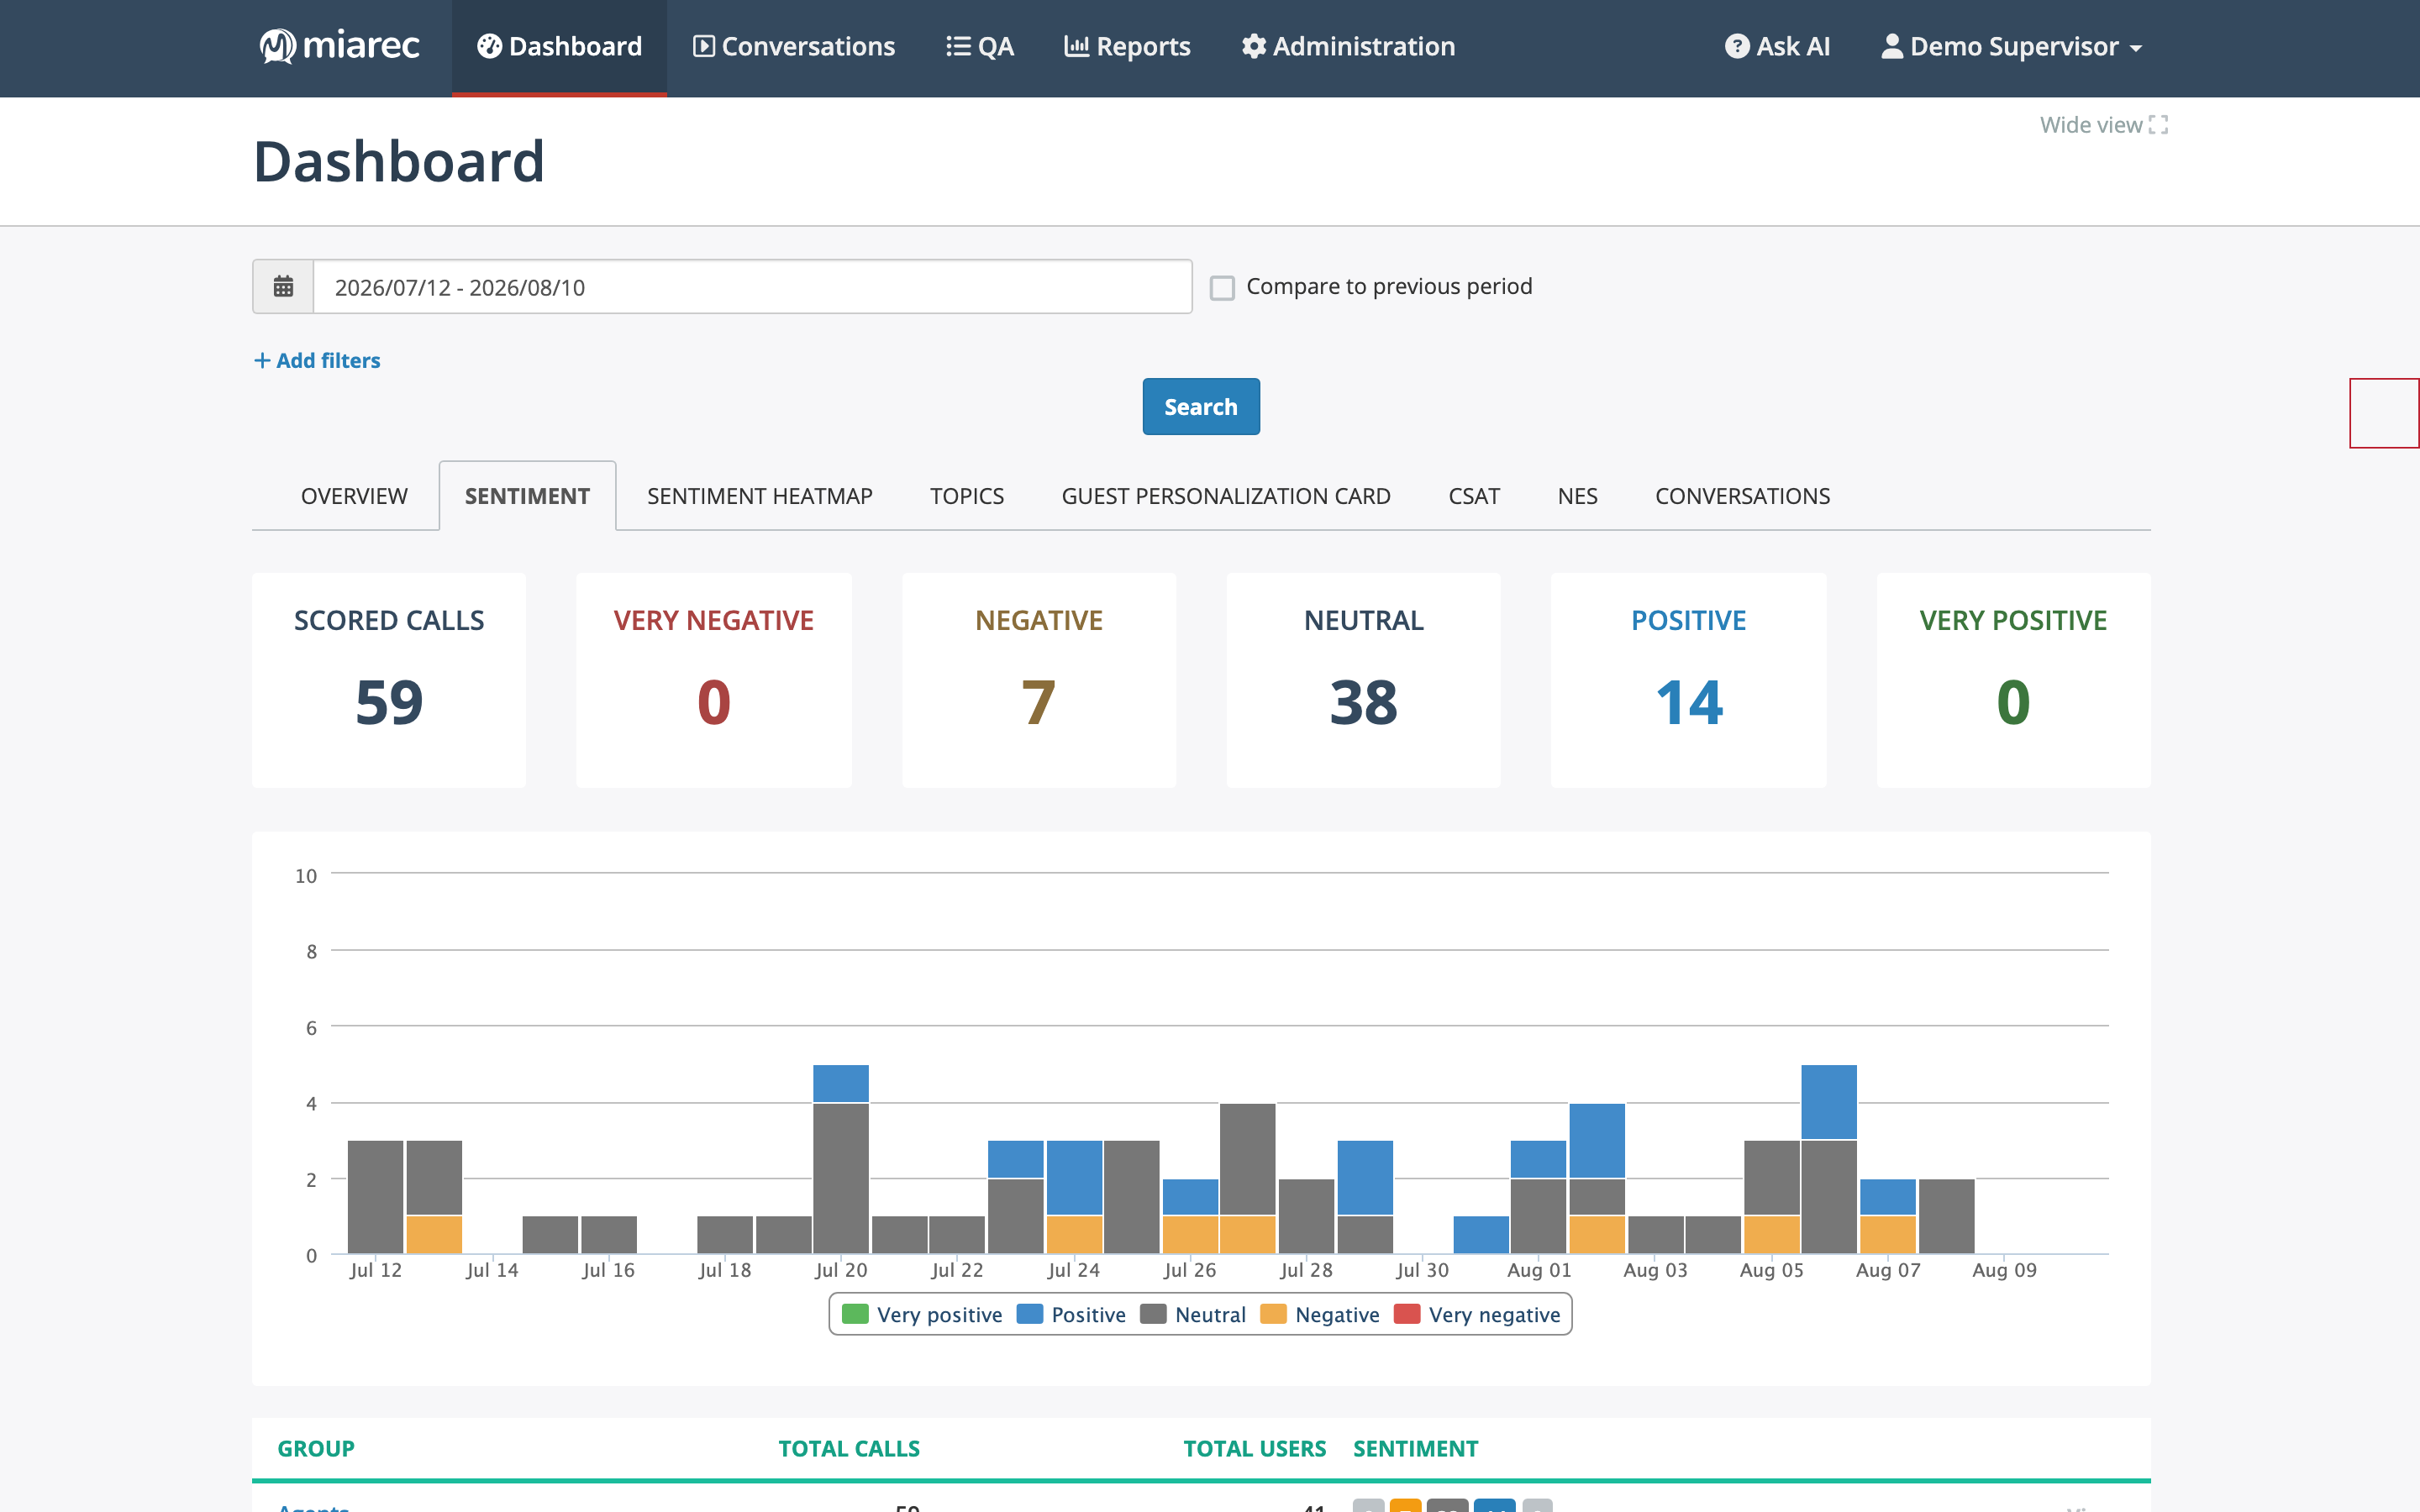
The Sentiment tab. Notice the counters — total scored conversations plus one counter per sentiment label — and the daily chart stacked by sentiment.
The Sentiment tab shows, for the selected period:
- Counters — the number of scored conversations (the "Scored calls" tile) and the number of conversations in each of the five sentiment categories.
- Trend chart — conversations per day, stacked by sentiment label, so you can spot days with an unusual share of negative conversations.
- Breakdown table — at the organization level, a per-group table with each group's sentiment distribution shown as labeled bars; hover over a bar segment to see the category name. Click a group to drill down.
How scores map to labels
Each label covers a fixed band of the -100..+100 score scale:
- Very negative — scores below -60
- Negative — scores from -60 up to -20
- Neutral — scores from -20 up to +20
- Positive — scores from +20 up to +60
- Very positive — scores of +60 and above
Sentiment Heatmap tab
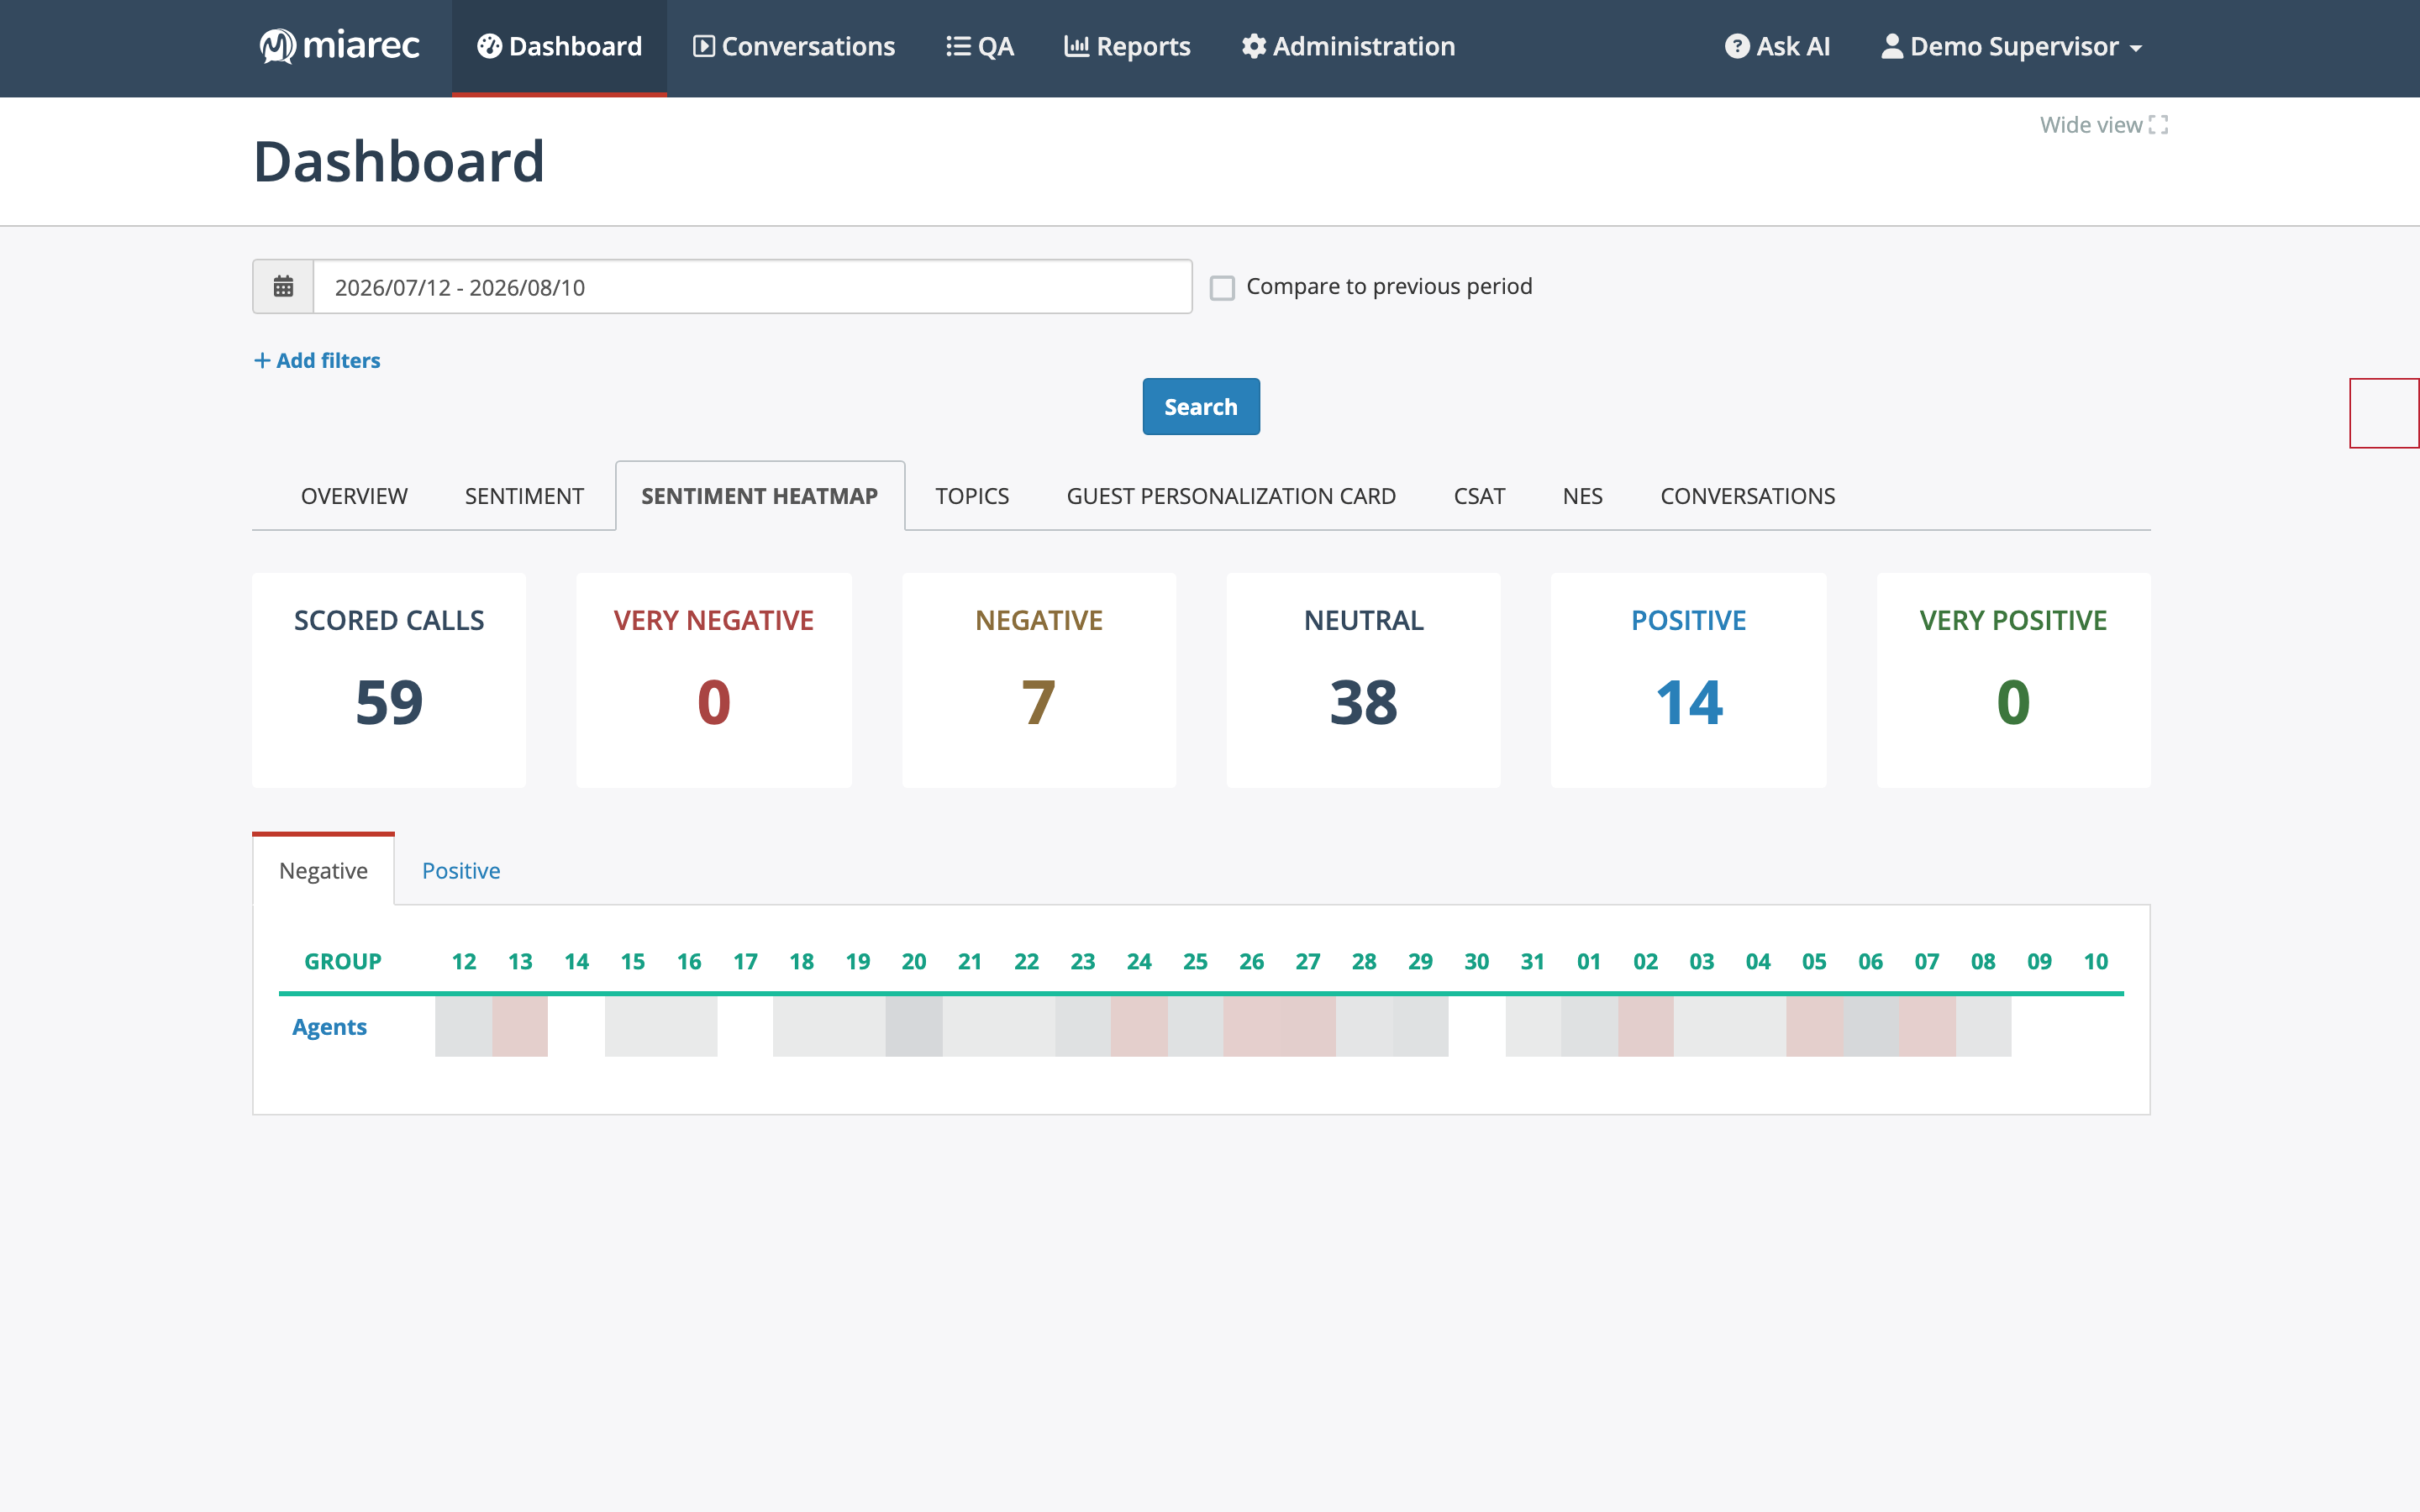
The Sentiment Heatmap tab. Each row is a group and each column a day; darker cells mark days with a higher share of negative conversations.
The Sentiment Heatmap tab plots sentiment over a grid of groups (rows) and days (columns), making patterns easy to spot — for example, a group whose conversations turn negative every Monday. Two sub-tabs switch the focus:
- Negative — cell shading reflects negative conversations; use it to find trouble spots.
- Positive — the same grid for positive conversations.
Note
The heatmap is limited to the last 30 days of the selected date range — a longer range is truncated to its final 30 days; a shorter range is shown in full.
Sentiment at deeper levels
When you drill down to a single user, sentiment appears as a summary panel on the user's Overview tab, showing the count of conversations per sentiment category. To read the sentiment of an individual conversation — including the AI's written explanation — open the conversation's detail page; see Sentiment on conversations.
Related pages
- Drilling down — from the organization heatmap to a group or user.
- Filtering dashboard data — narrowing the data behind the charts.