Dashboards overview
The Dashboard page turns thousands of individual conversations into an at-a-glance picture of your organization: how many conversations happened, how customers felt, what they talked about, and how your customer-experience metrics are trending. From any aggregate number you can drill down to the underlying conversations.
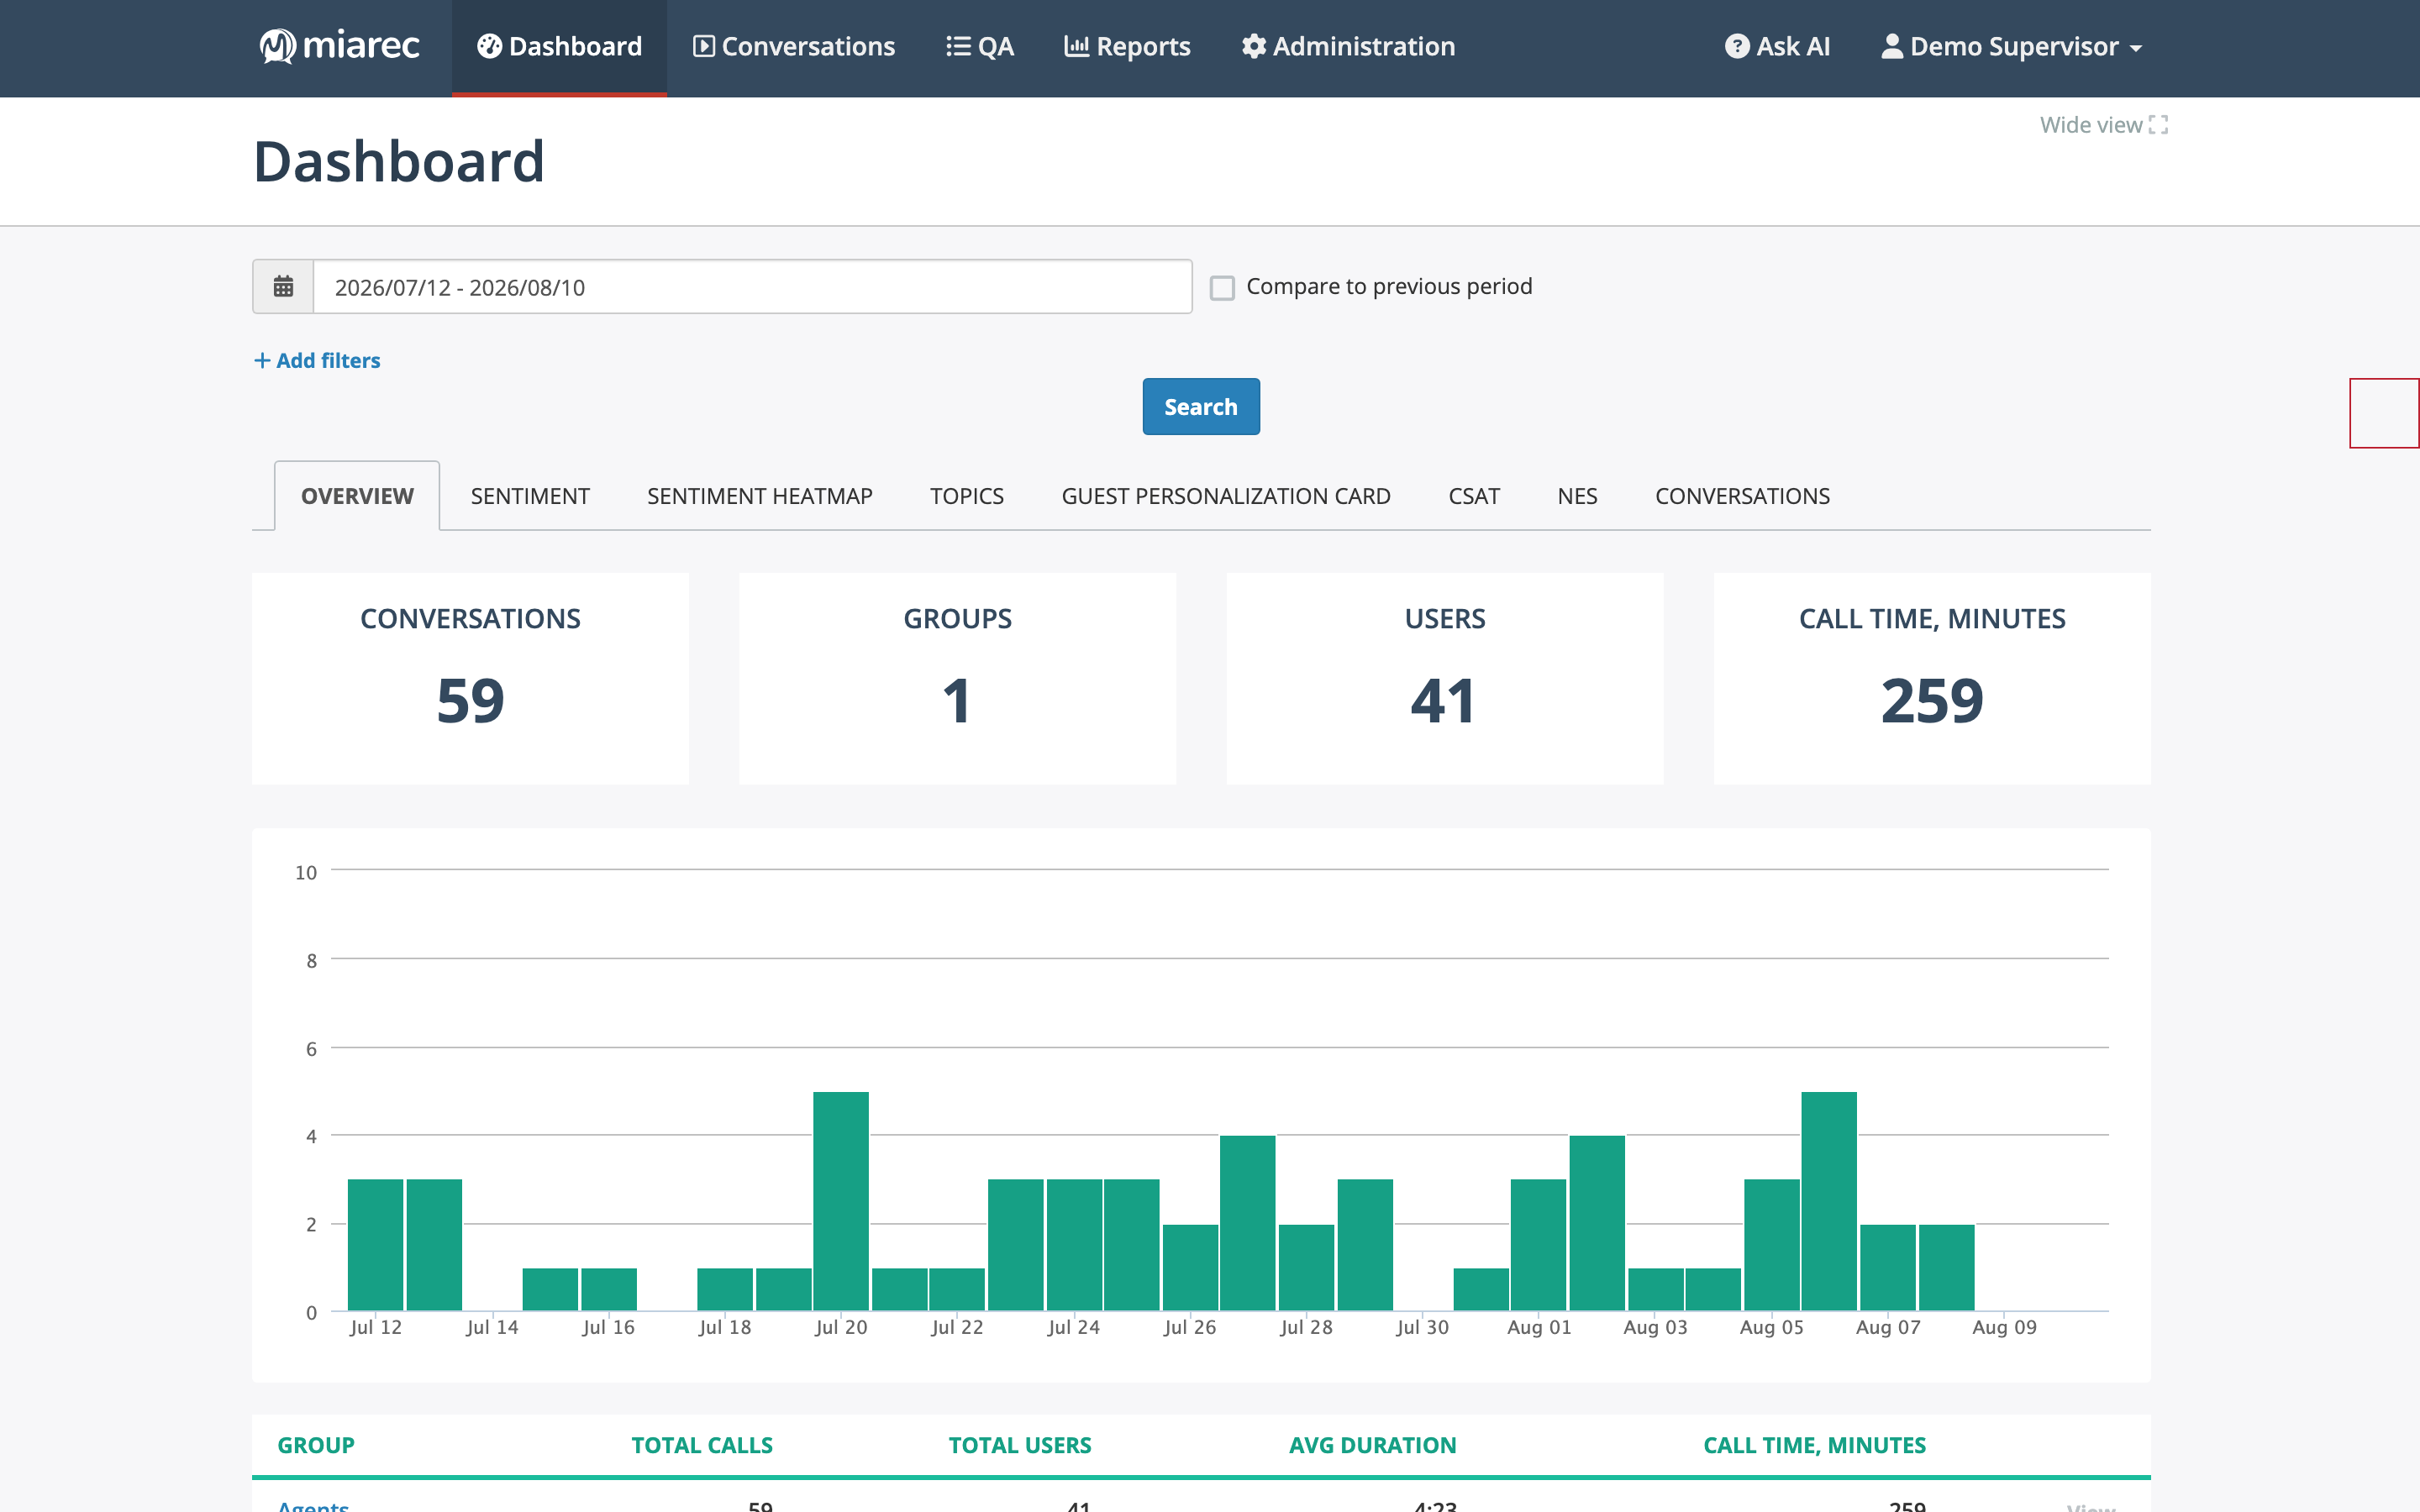
The organization-level dashboard. Notice the toolbar (date range, compare toggle, filters) and the row of tabs — one tab per analytics view, including a tab for each metric enabled for dashboards (such as CSAT and NES).
Where you land
Opening Dashboard from the navigation menu shows the widest view your access allows:
- Supervisors and administrators land on the organization-level dashboard, covering the groups they manage.
- Agents land on their personal dashboard, covering their own conversations only.
Dashboard scopes
Dashboards exist at four levels, connected by drill-down:
- Organization — all data you have access to, with a per-group breakdown.
- Group — one team's data, with a per-user breakdown.
- User — one person's conversations.
- Topic — conversations that matched one topic.
The tab model
Each dashboard is organized into tabs. At the organization level you can see:
- Overview — conversation volume and duration metrics. See Conversation metrics.
- Sentiment and Sentiment Heatmap — sentiment distribution and daily patterns. See Sentiment.
- Topics — what your customers talk about. See Topics.
- Metric tabs — one tab per AI-scored metric your organization has enabled for dashboards, such as CSAT or NES. See CX metric dashboards.
- Conversations — the list of conversations behind the numbers, honoring the selected period and filters. See Conversation metrics.
Deeper scopes show fewer tabs — a user-level dashboard, for example, has Overview and Conversations tabs, with a sentiment summary panel on the overview.
Info
The exact set of tabs depends on your organization's subscription and configuration. Sentiment and topics tabs require Conversation Analytics; metric tabs appear only for custom metrics your administrator has enabled for dashboards.
The toolbar
Every dashboard shares the same toolbar:
- Date range — the period the metrics cover.
- Compare to previous period — adds period-over-period changes to the metrics.
- Add filters — narrows the data by criteria such as call direction or duration.
- Search — applies your date range and filter changes.
Note
Dashboard metrics are computed in the background. When you open a dashboard or change the period, a panel may show a loading state for a few moments before the numbers appear.
Next steps
- Conversation metrics — the Overview and Conversations tabs.
- Drilling down — moving between organization, group, user, and topic dashboards.