QA dashboard
The QA dashboard (QA › Overview) summarizes evaluation results for the period you select: how many conversations were evaluated, how many passed, and how the average score is trending. Supervisors use it to monitor team performance and spot emerging problems; agents see the same dashboard scoped to their own results.
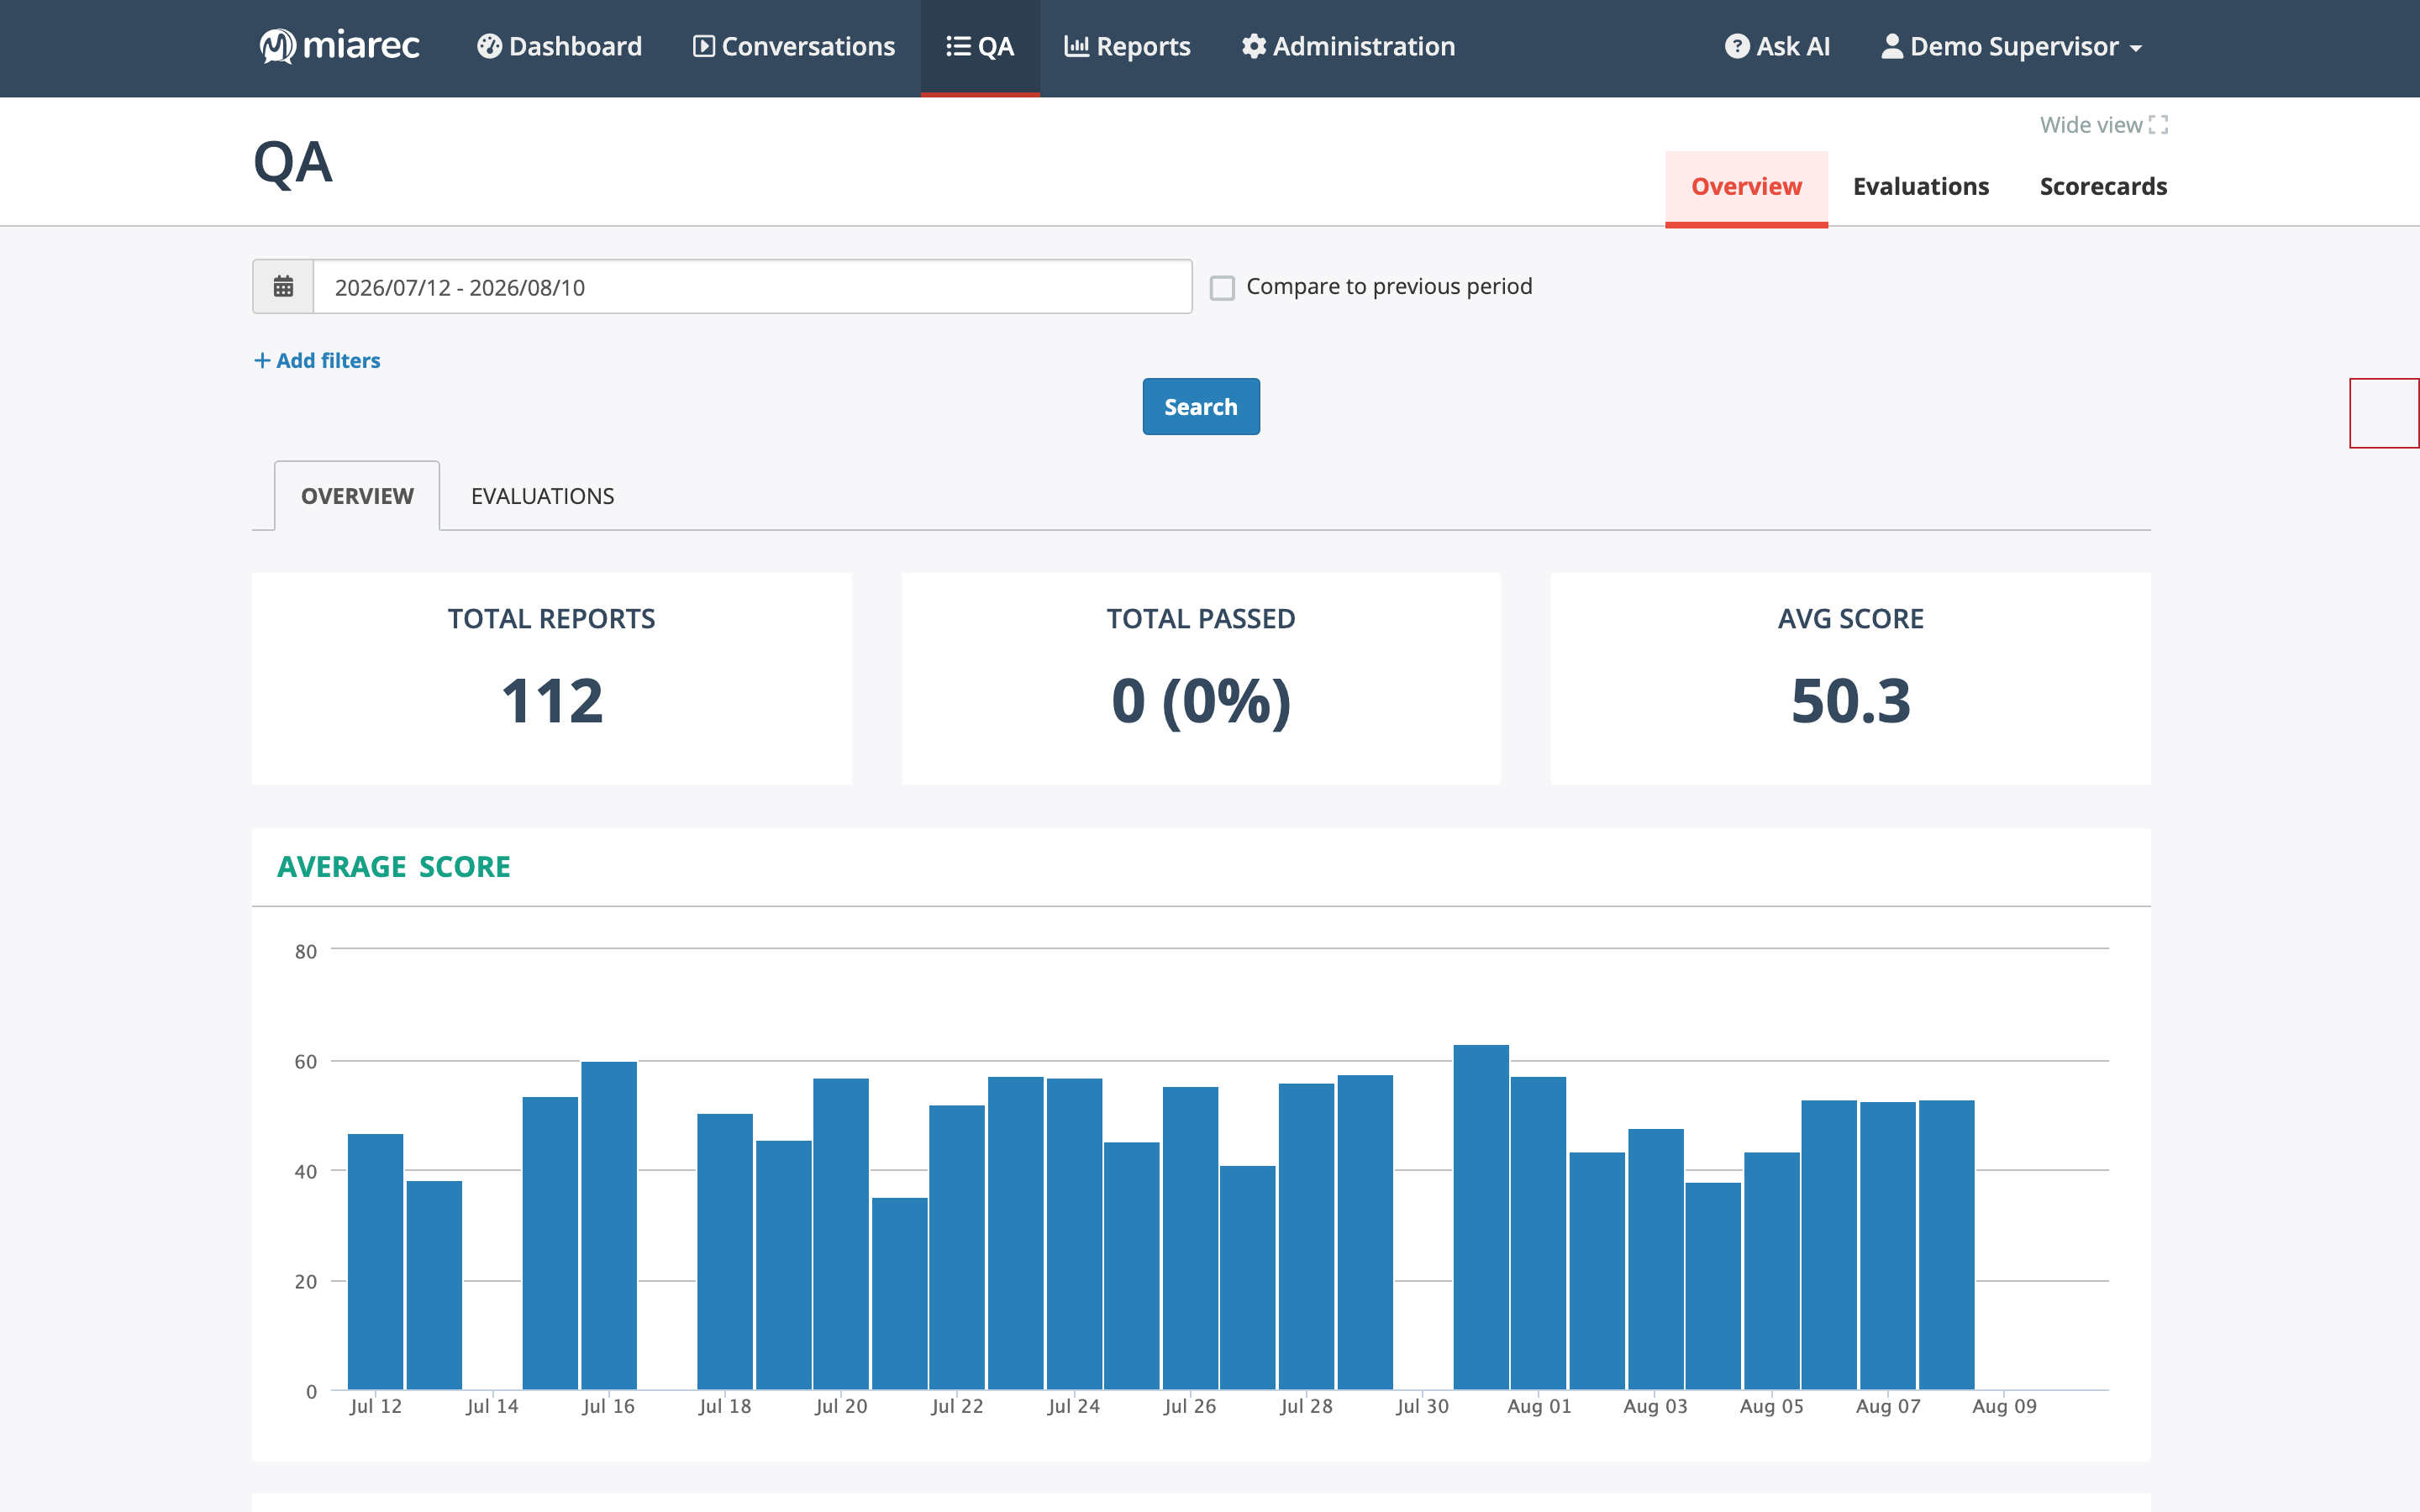
The QA dashboard: totals for the selected period and the average score per day. The dashboard opens at the widest scope your role allows — organization-wide for supervisors, your own results for agents.
Reading the dashboard
The Overview tab shows:
- Total Reports — the number of evaluations of conversations in the selected period (the dashboard groups by conversation date, not by when the evaluation was created).
- Total Passed — how many of them passed their scorecard's passing threshold.
- Avg Score — the average evaluation score.
- Average score chart — the score trend per day.
- Breakdown tables — results grouped by scorecard and by group, further down the page.
The Evaluations tab lists the evaluations behind the numbers, so you can jump from an aggregate straight to a specific evaluation with its per-question detail.
Drilling down
From the breakdown tables you can drill into a narrower scope:
- Click View next to a group to see that team's dashboard, then next to a user to see an individual agent.
- Click a scorecard name to see results for that scorecard, including per-section and per-question averages — useful for finding the specific question a team consistently fails.
Use the breadcrumb trail at the top of the page to move back up to the wider scope.
Filtering the data
- Date range — pick one of the presets (Today, Yesterday, Last 7 Days, Last 30 Days, This Month, Last Month) or choose a custom date range.
- Compare to previous period — when checked, every metric is compared against the identical preceding timeframe and the change is shown as a percentage.
- Add filters — restrict the underlying conversations, for example to inbound conversations only or to a duration range.
Click Search to apply your selection.
Beyond the dashboard
For tabular reporting — evaluation scores in a scheduled report, or per-question columns exported to Excel — use the reports with evaluation columns instead of the dashboard. You can also query evaluations directly with advanced search, which exposes evaluation attributes as search criteria.