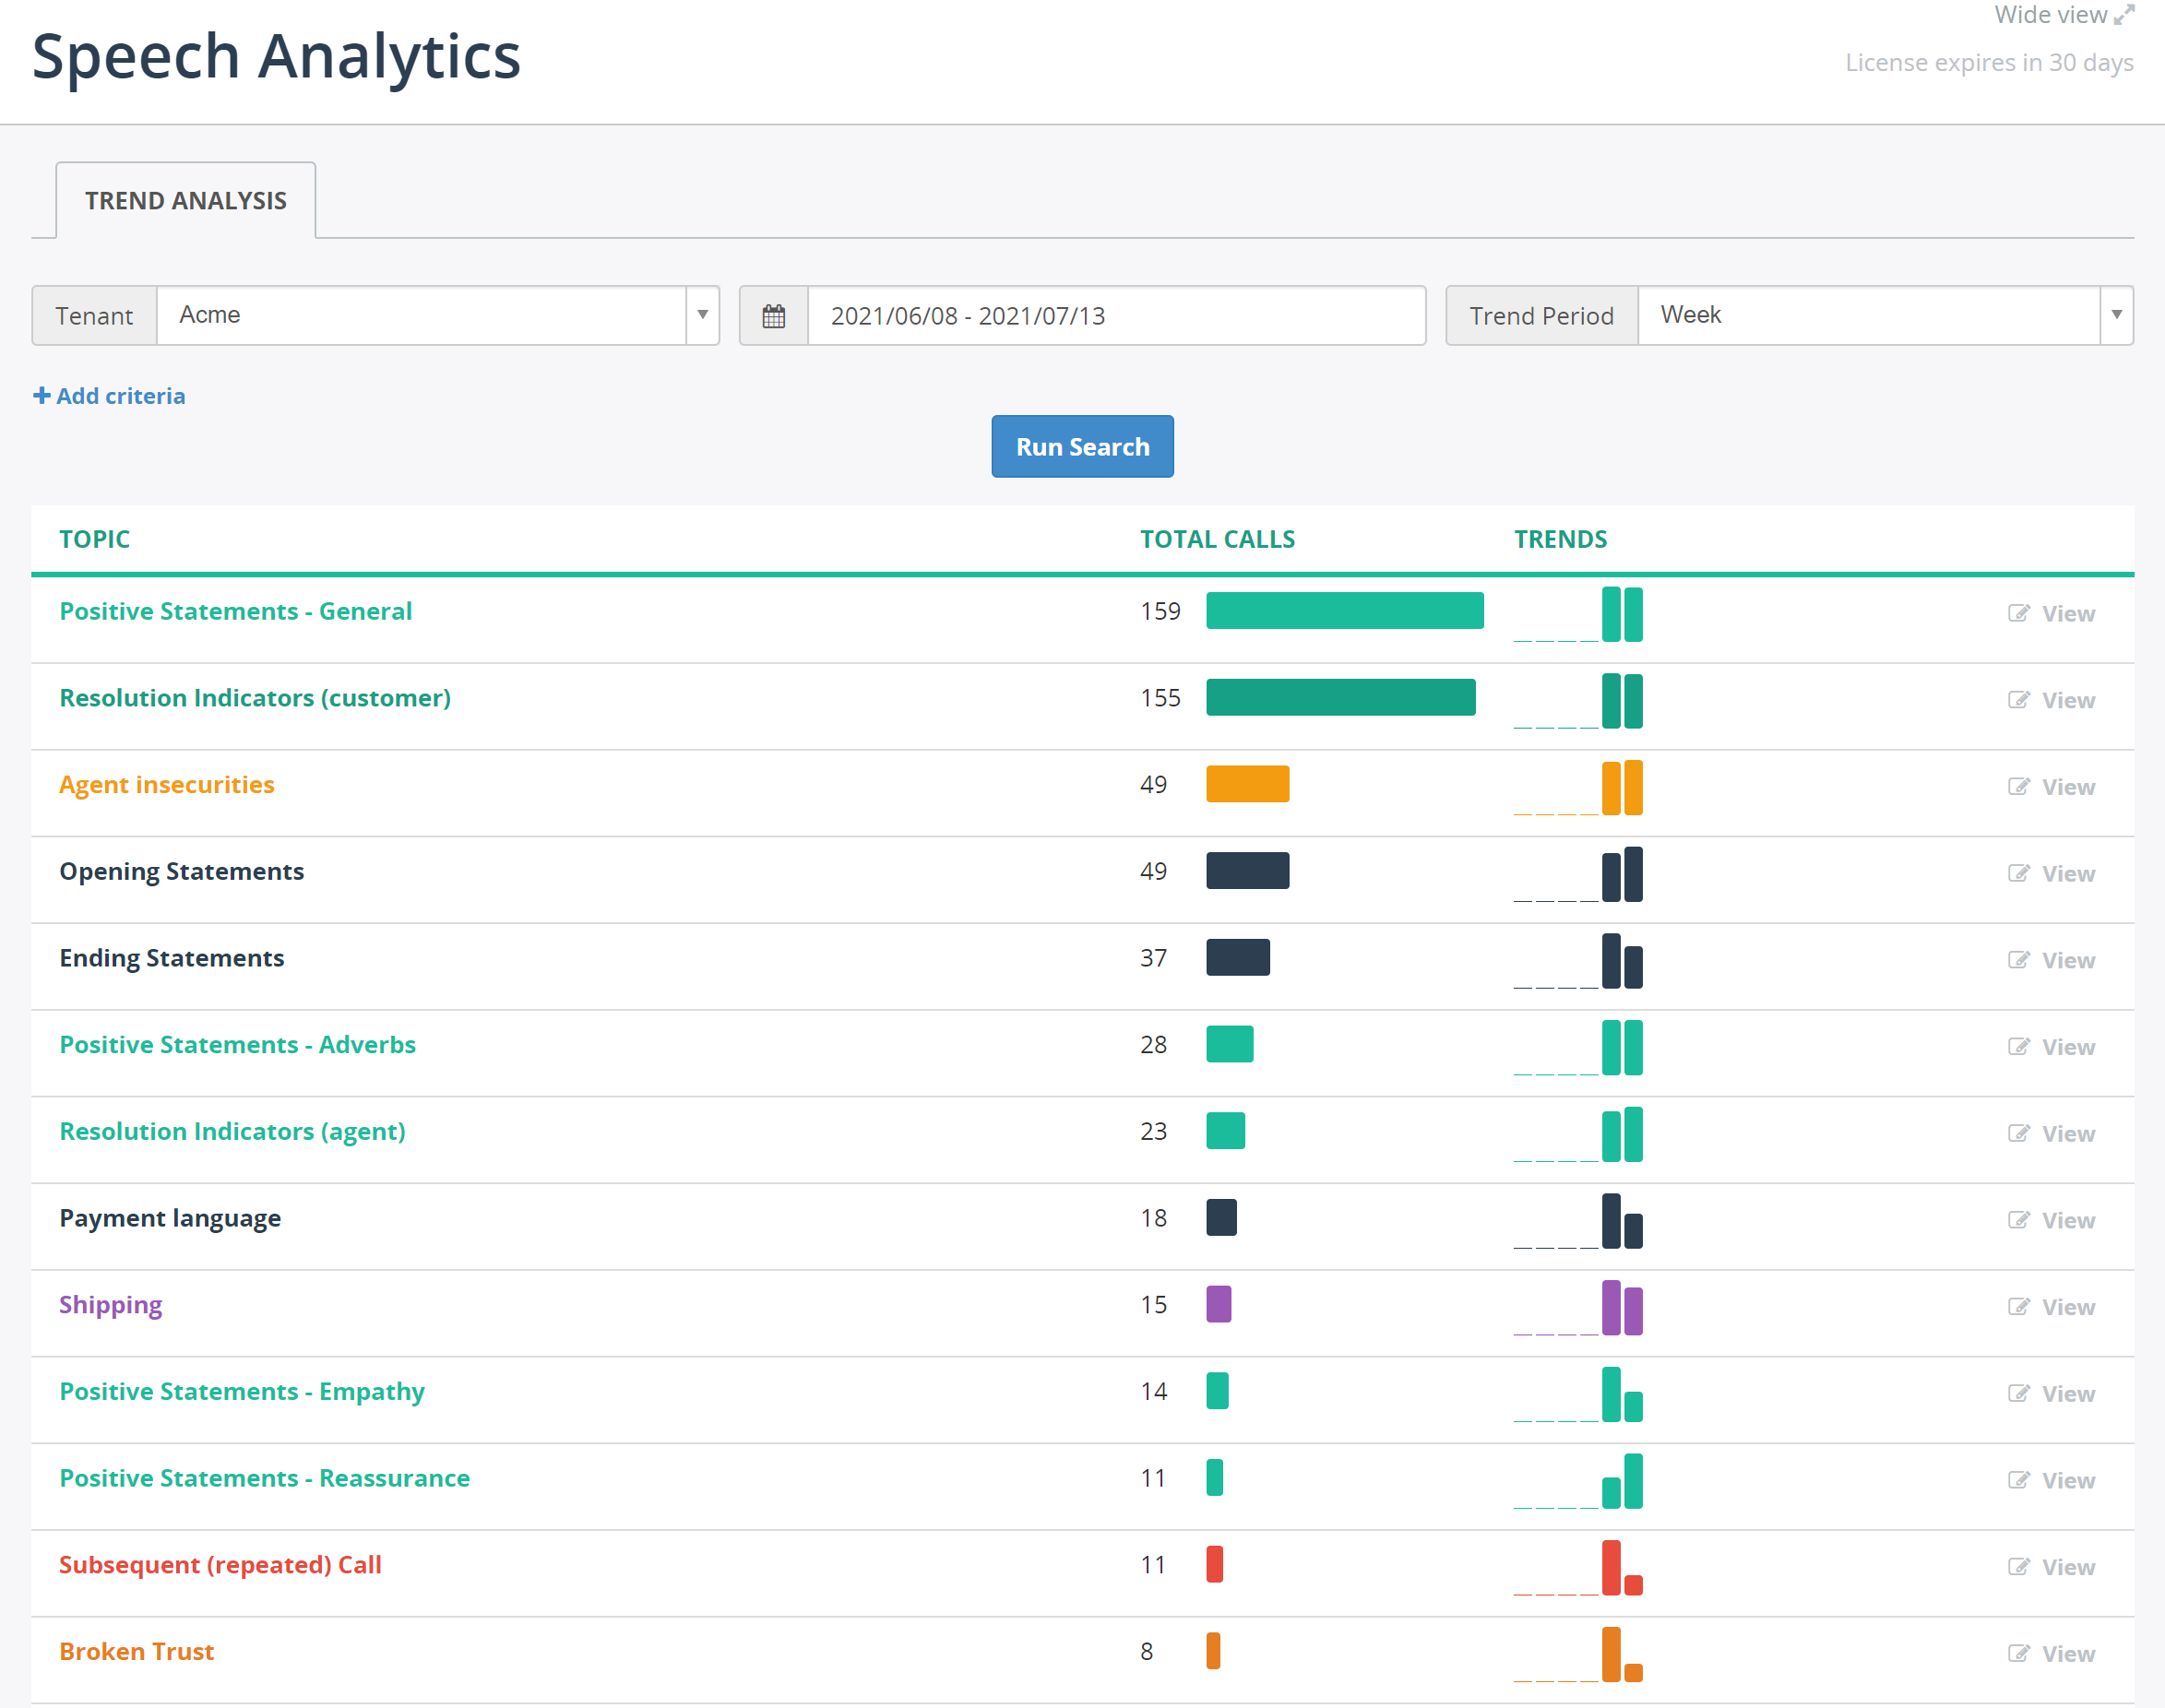
Topics dashboard
In the Topics dashboard you can see how many calls you have for each topic for the certain period of time.
Navigate to Dashboard > Topics to see the dashboard.
You choose a different period for analysis by changing a date range in search panel and clicking Search button.
In Topics dashboard, you can see:
- Total number of calls for each topic for a whole period (column Total Calls)
- Average call duration
- Total call time, in minutes
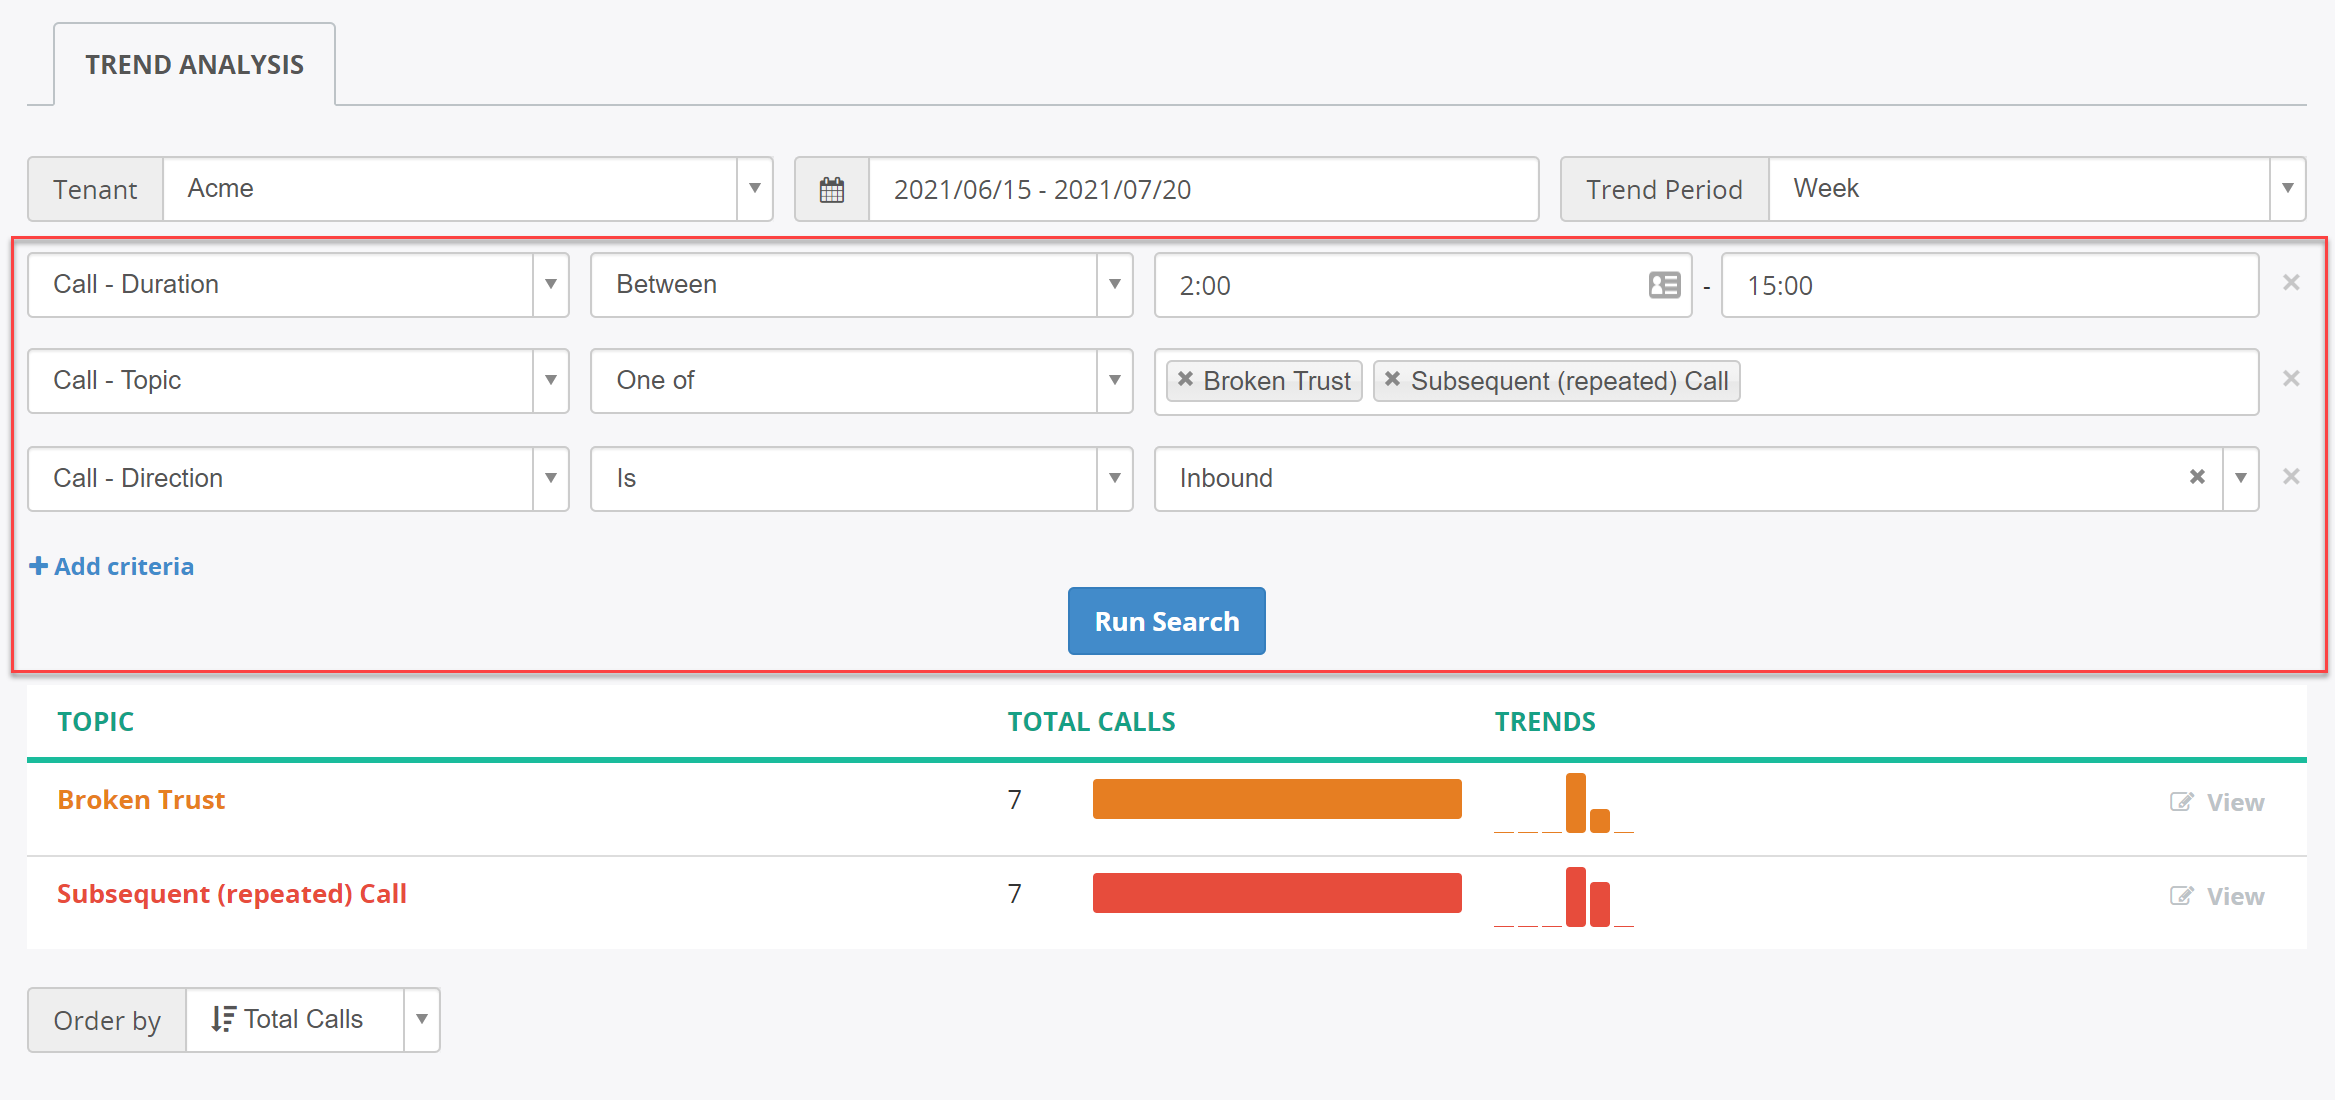
You can can narrow-down search to focus on particular calls, like shown in the following screenshot:
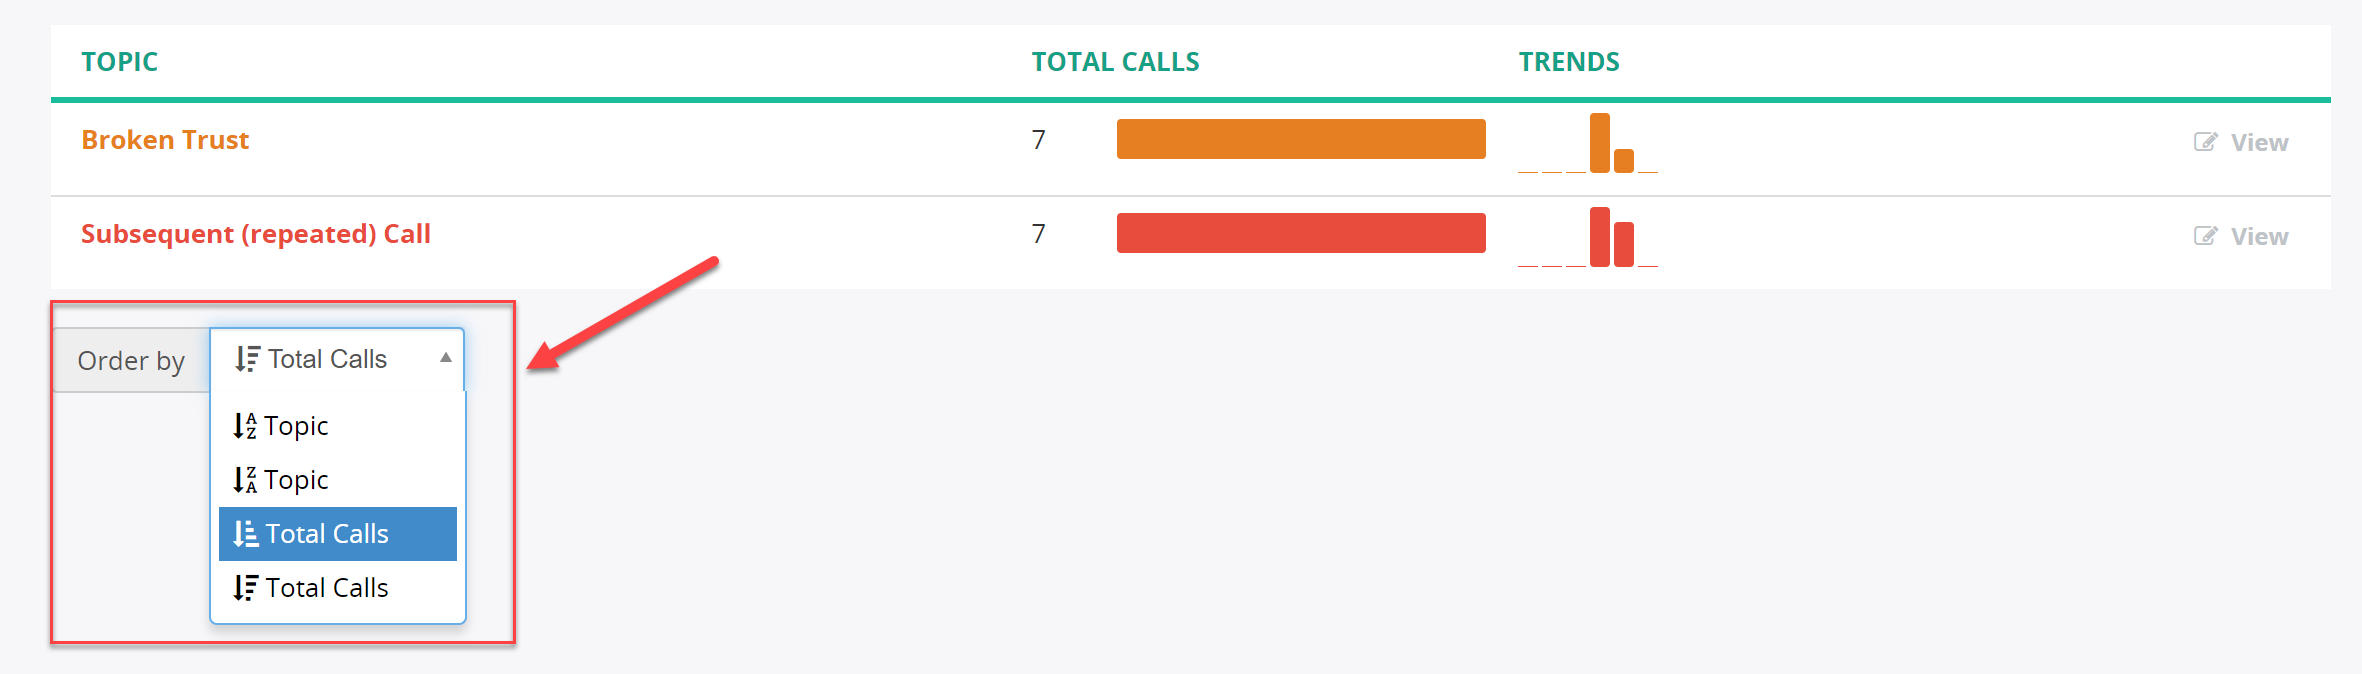
By default, topics on Trend Analysis page is ordered by Total Calls, with topics with highest number of calls shown at the top. You can change the order by clicking Order By select box in the bottom of table:
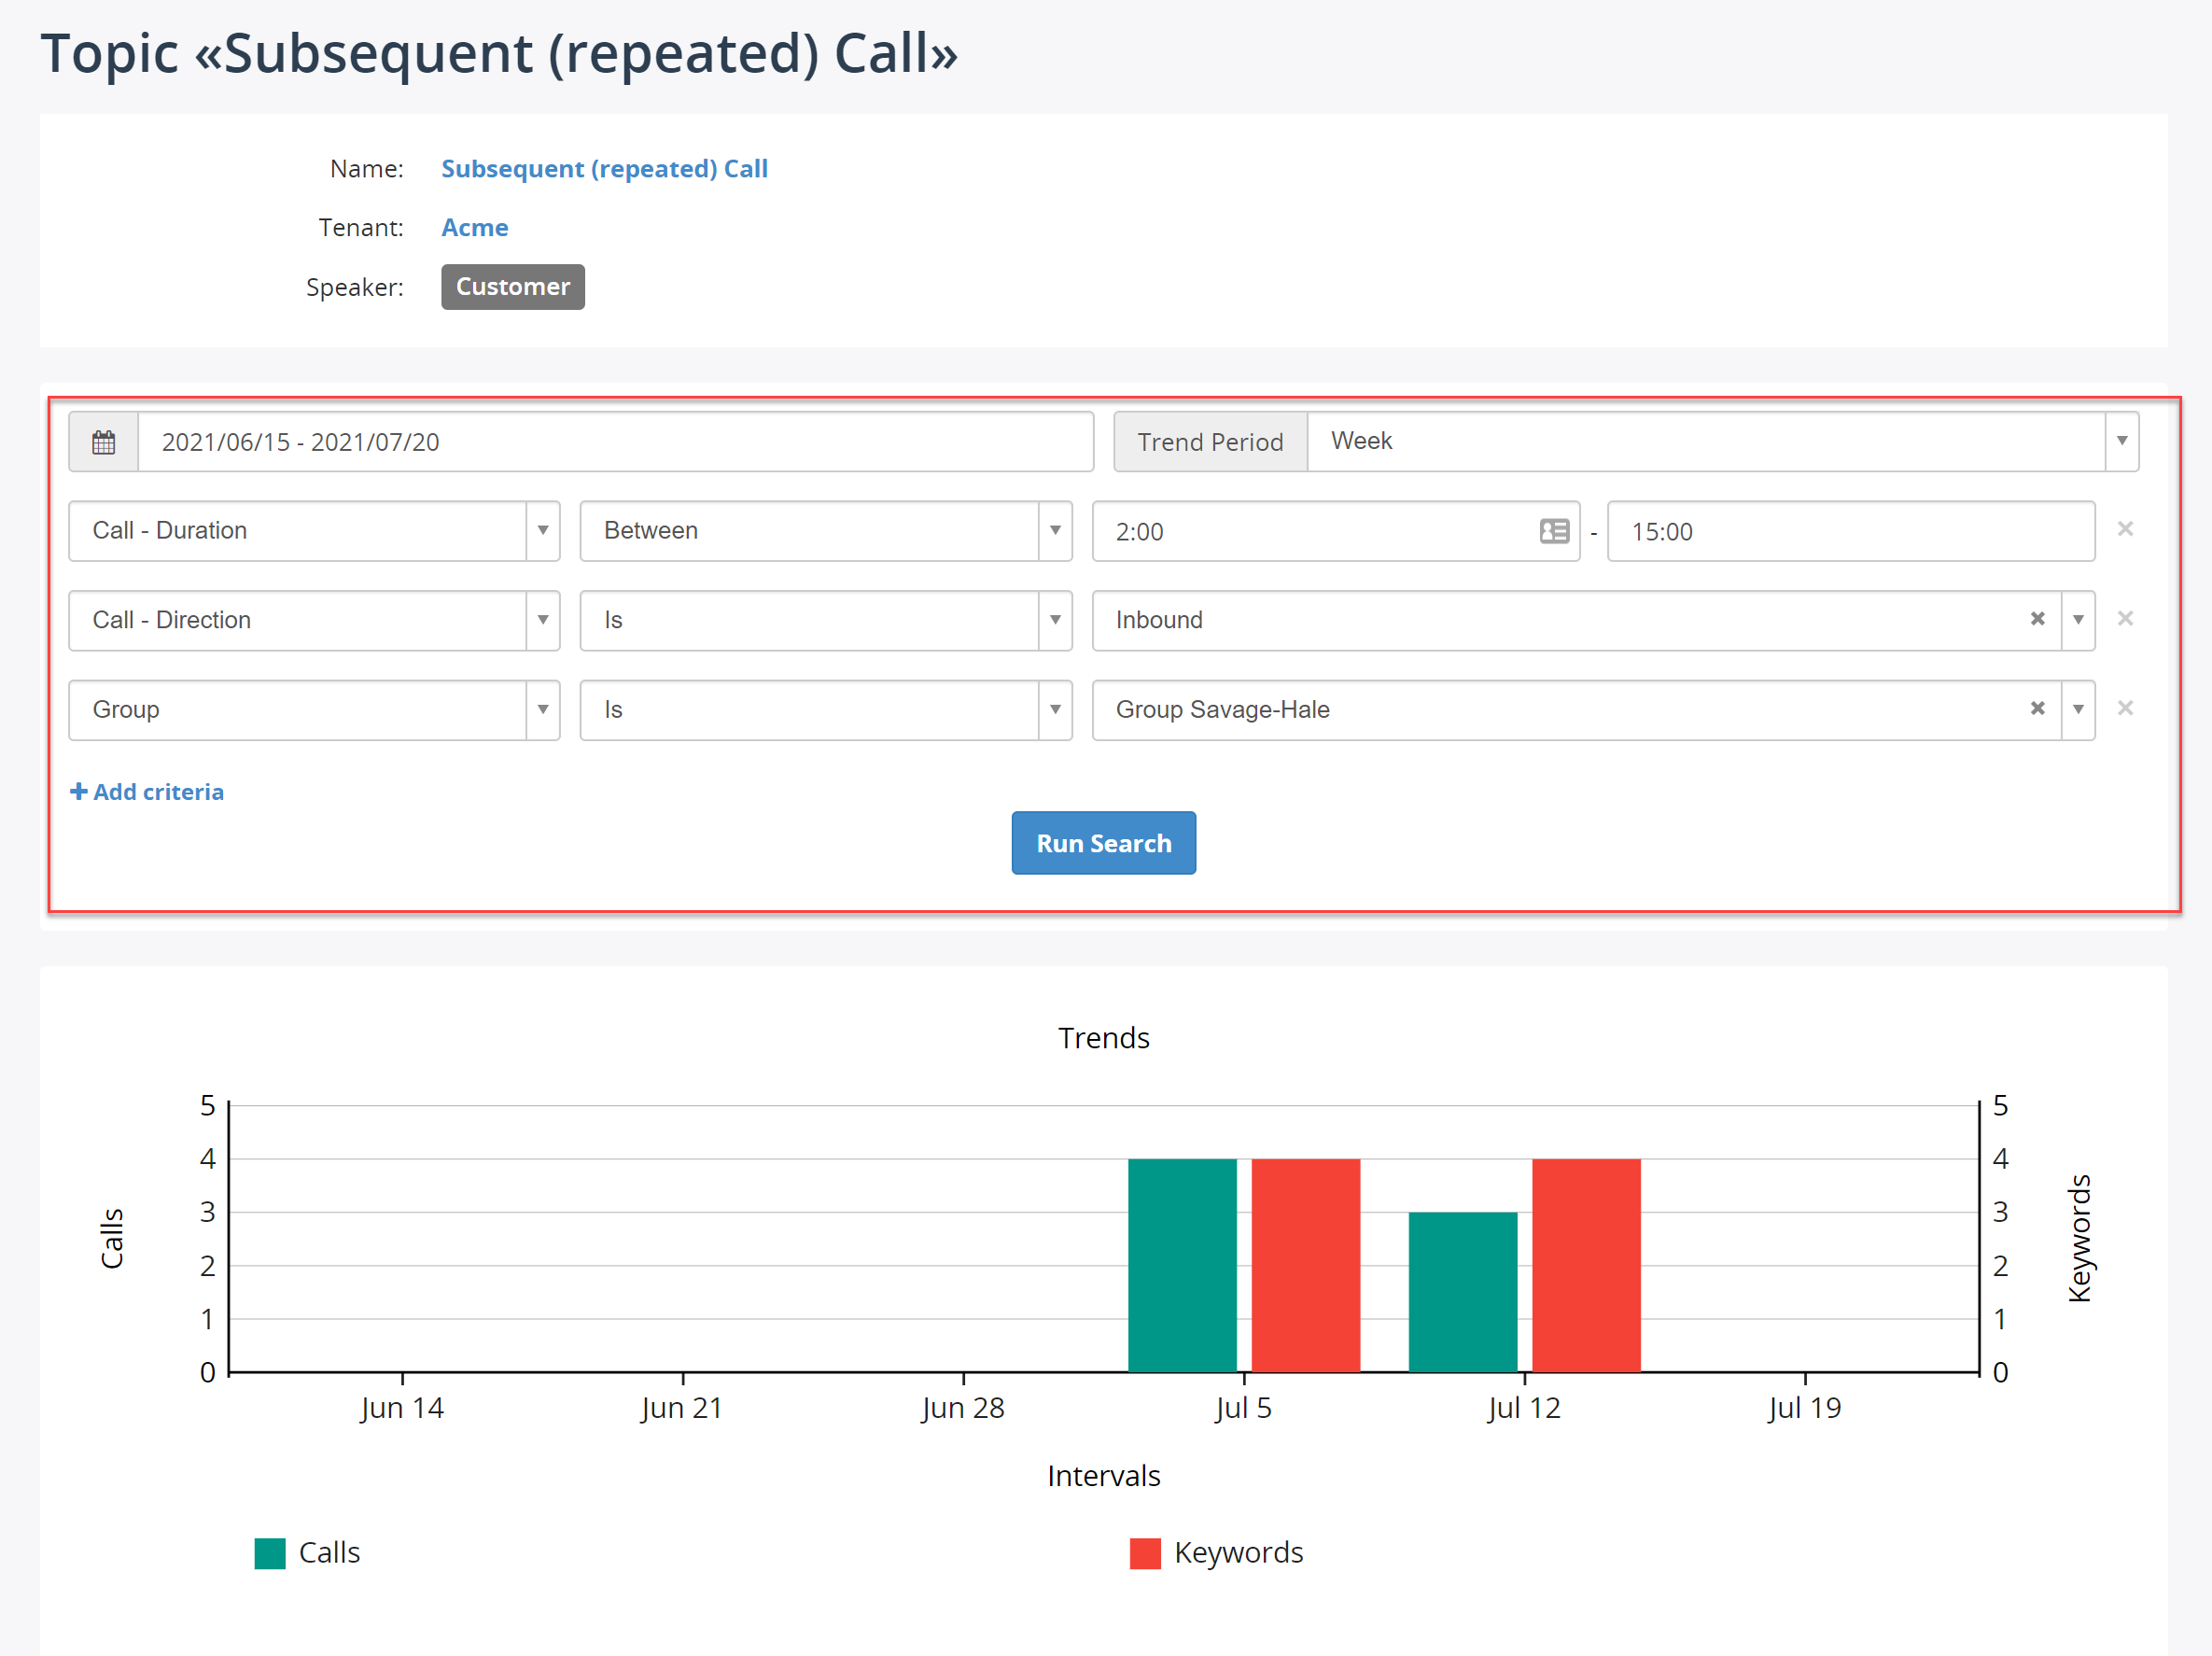
Trend analysis for individual topic
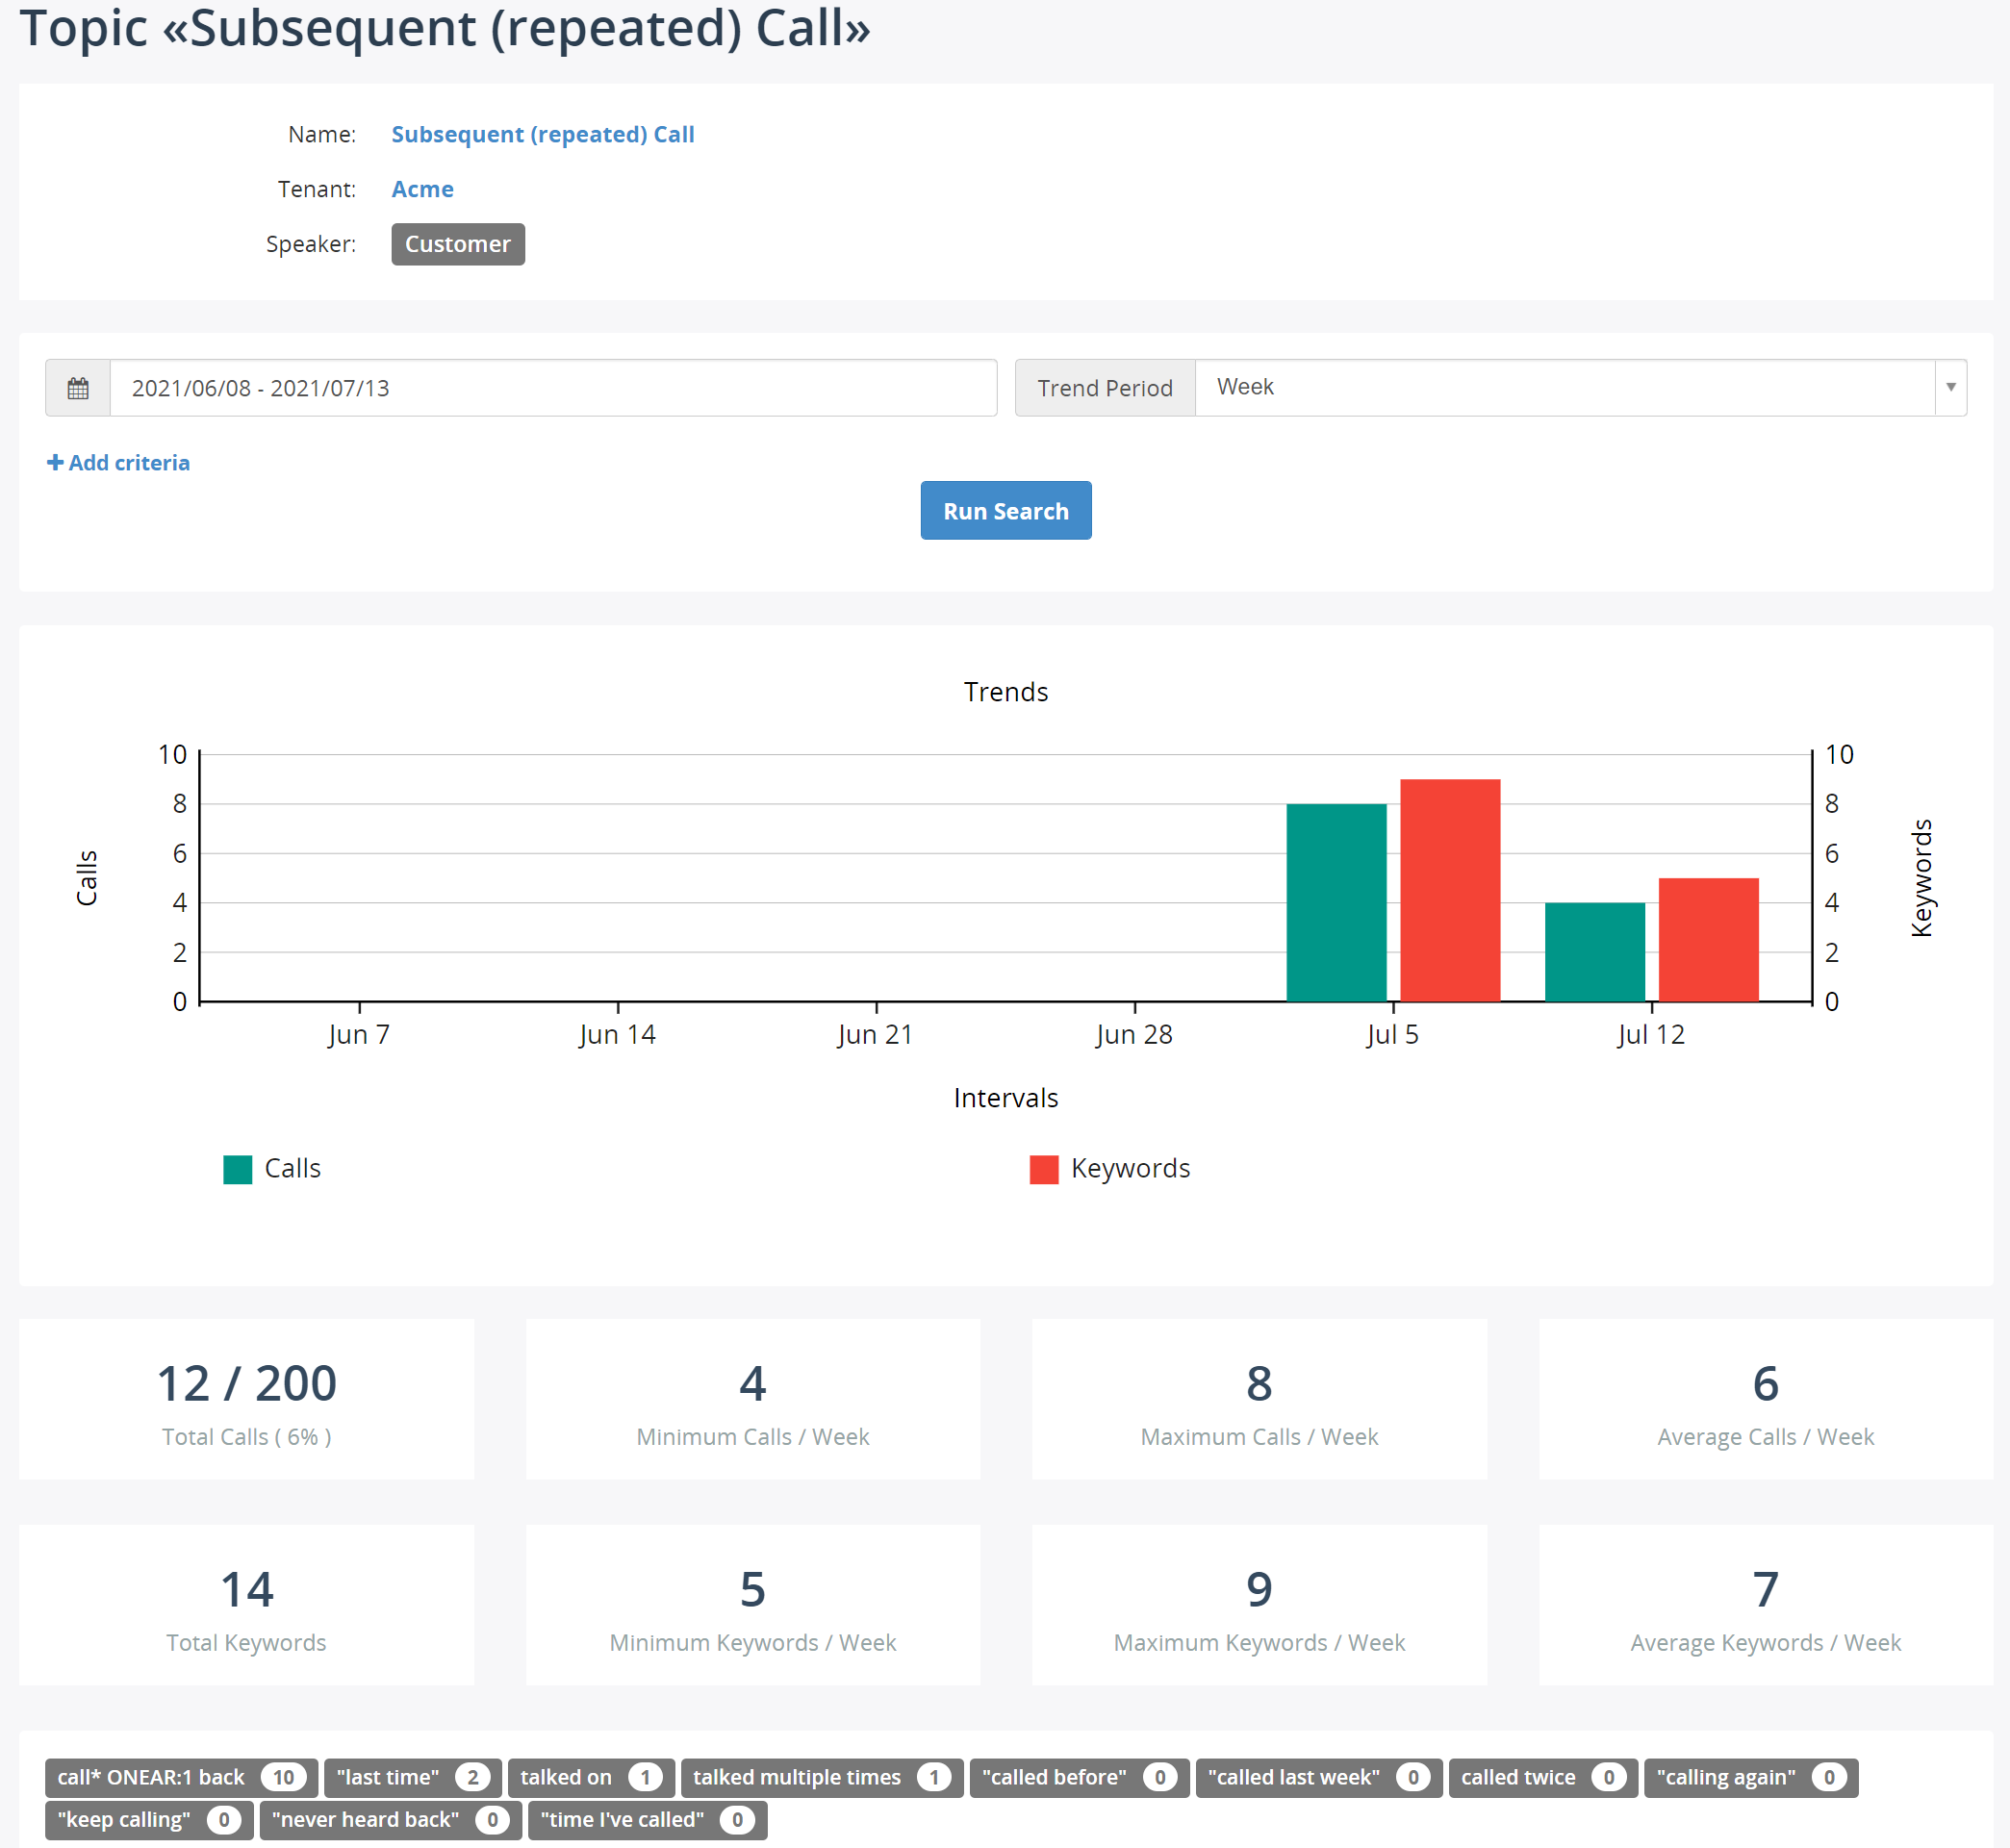
Click View link for a topic to see metrics for this topic only. The following screenshot demonstrates metrics for topic Subsequent (repeated) calls.
On this page, you can see:
- A chart, displaying trends of topics over the selected period of time. You can change a period of time in the search panel and click Search button to re-calculate trends.
- Various metrics, like minimum, maximum and average calls per period, total/min/max/avg keywords etc.
- A list of keywords in the topic. Each keywords shows a numeric value, representing how many times it was spotted in calls for this period of time.
At the bottom of this page, you can see call recordings matching the search criteria:
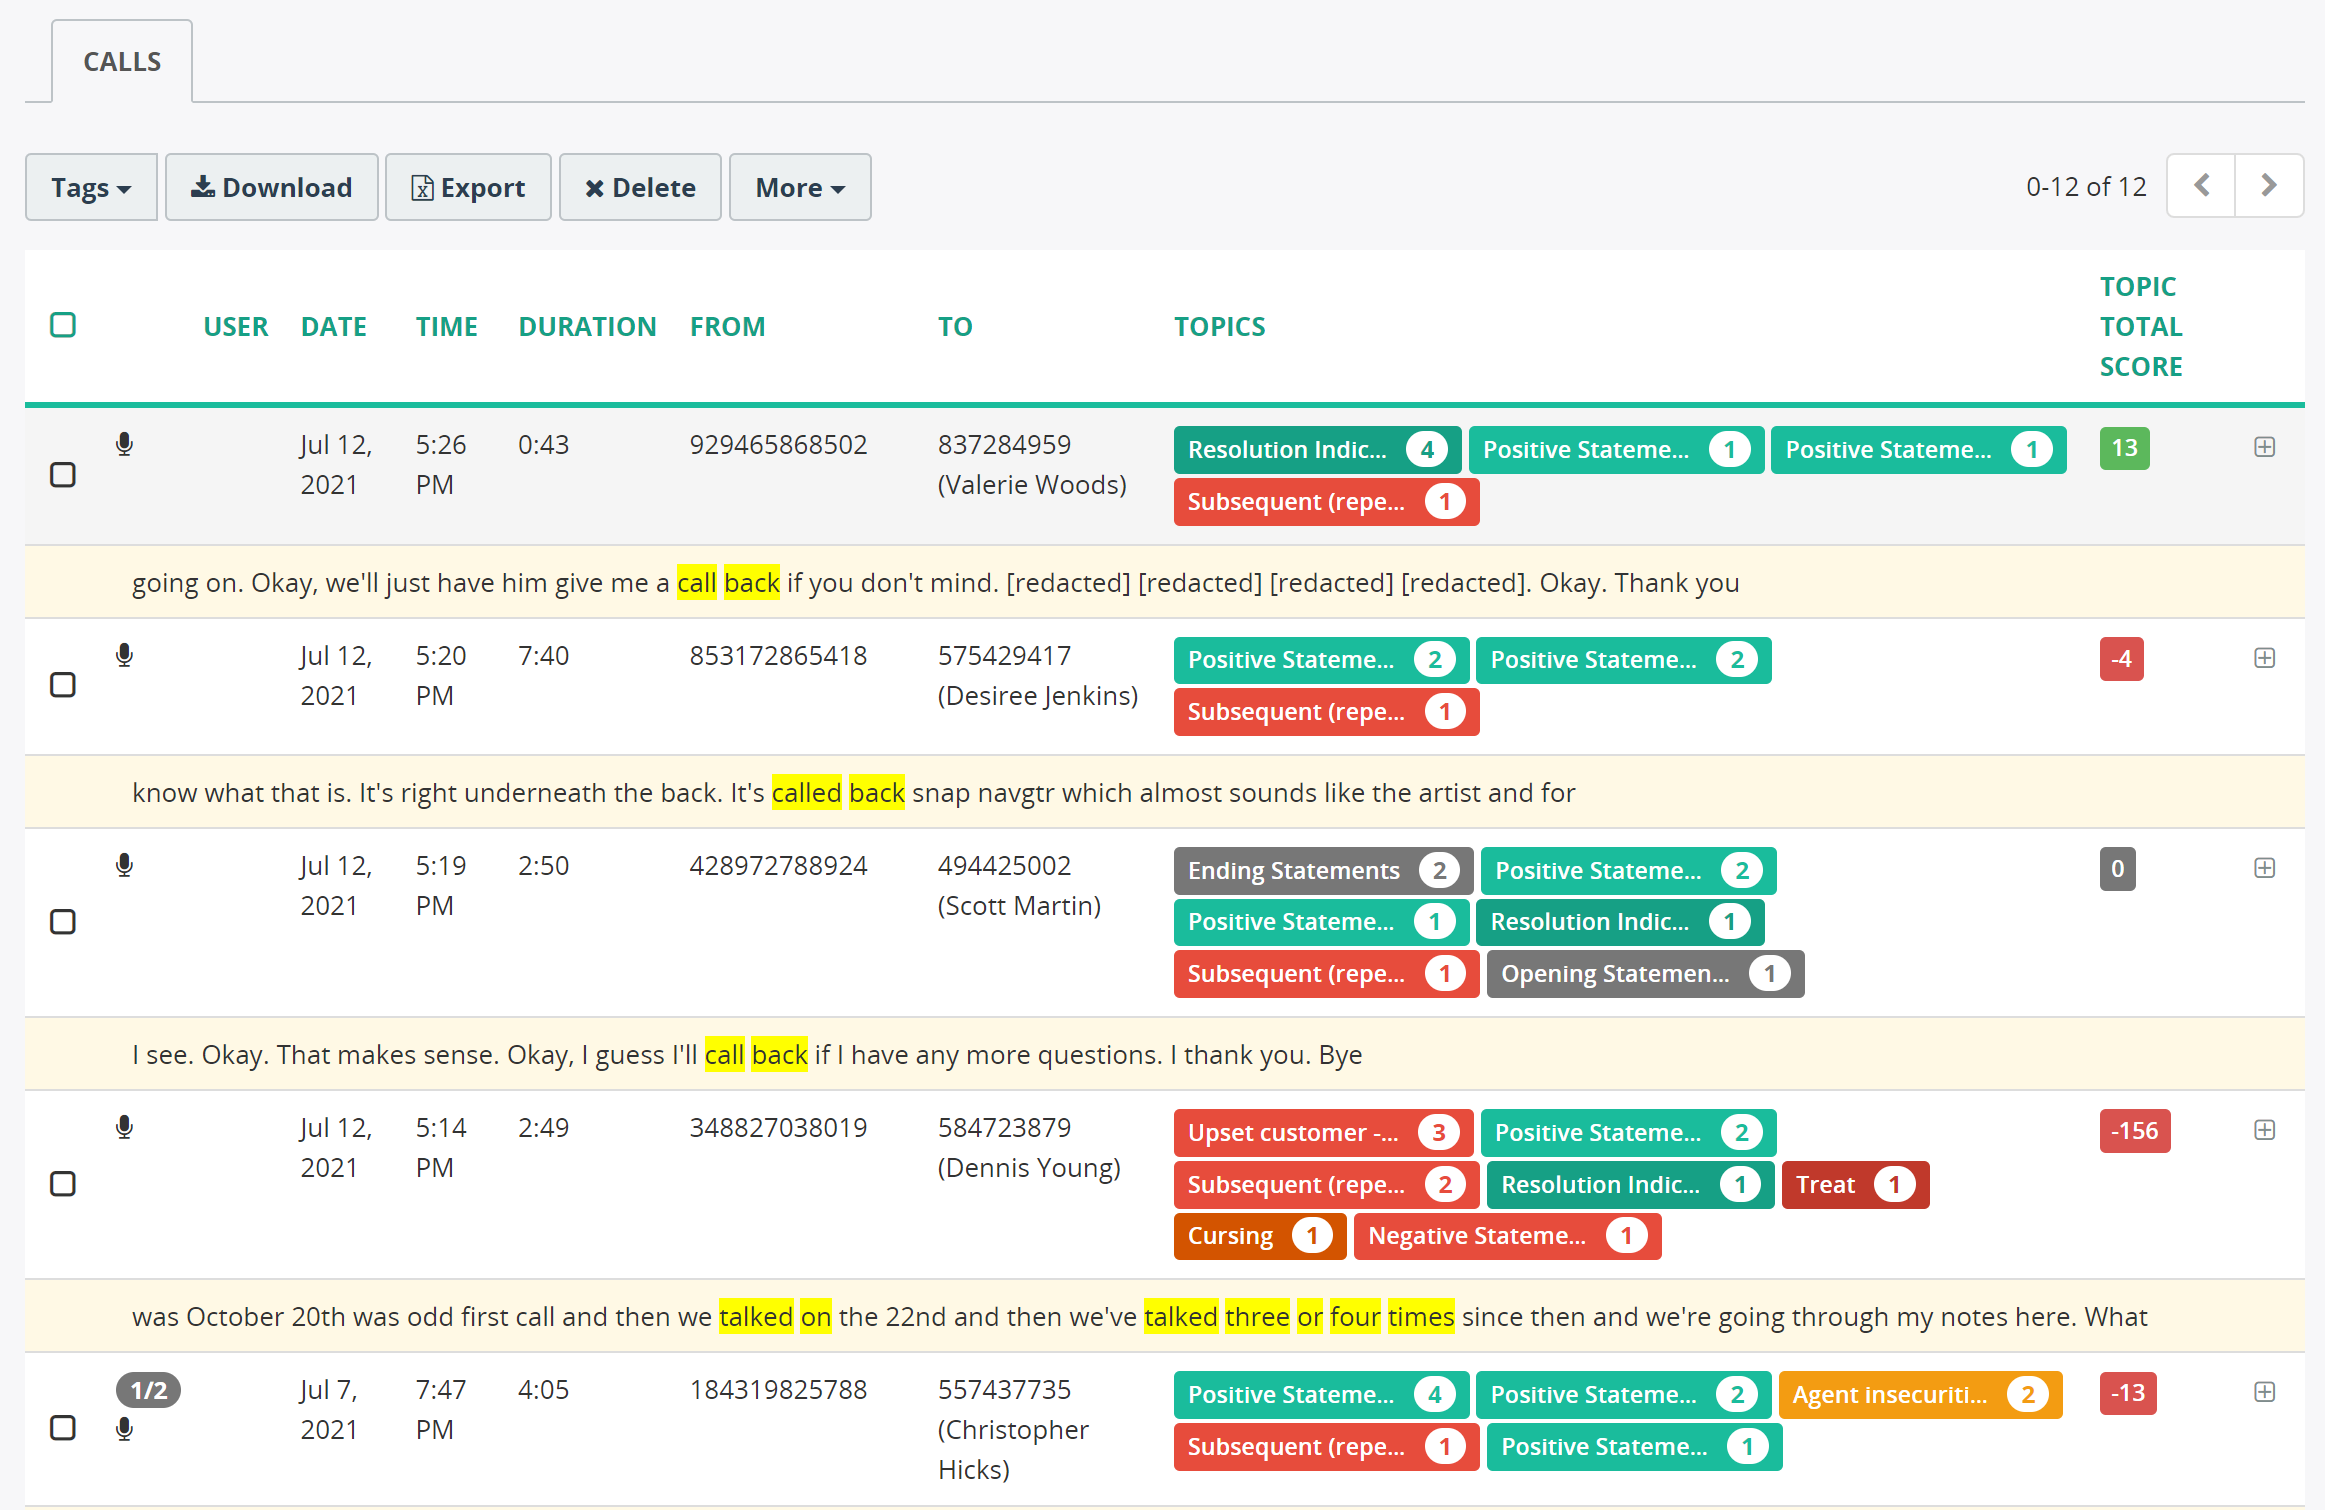
You can narrow down search by selecting criteria in the search panel and clicking Search button. For example, you can choose Group, Call duration, Call direction and other attributes to filter data.